


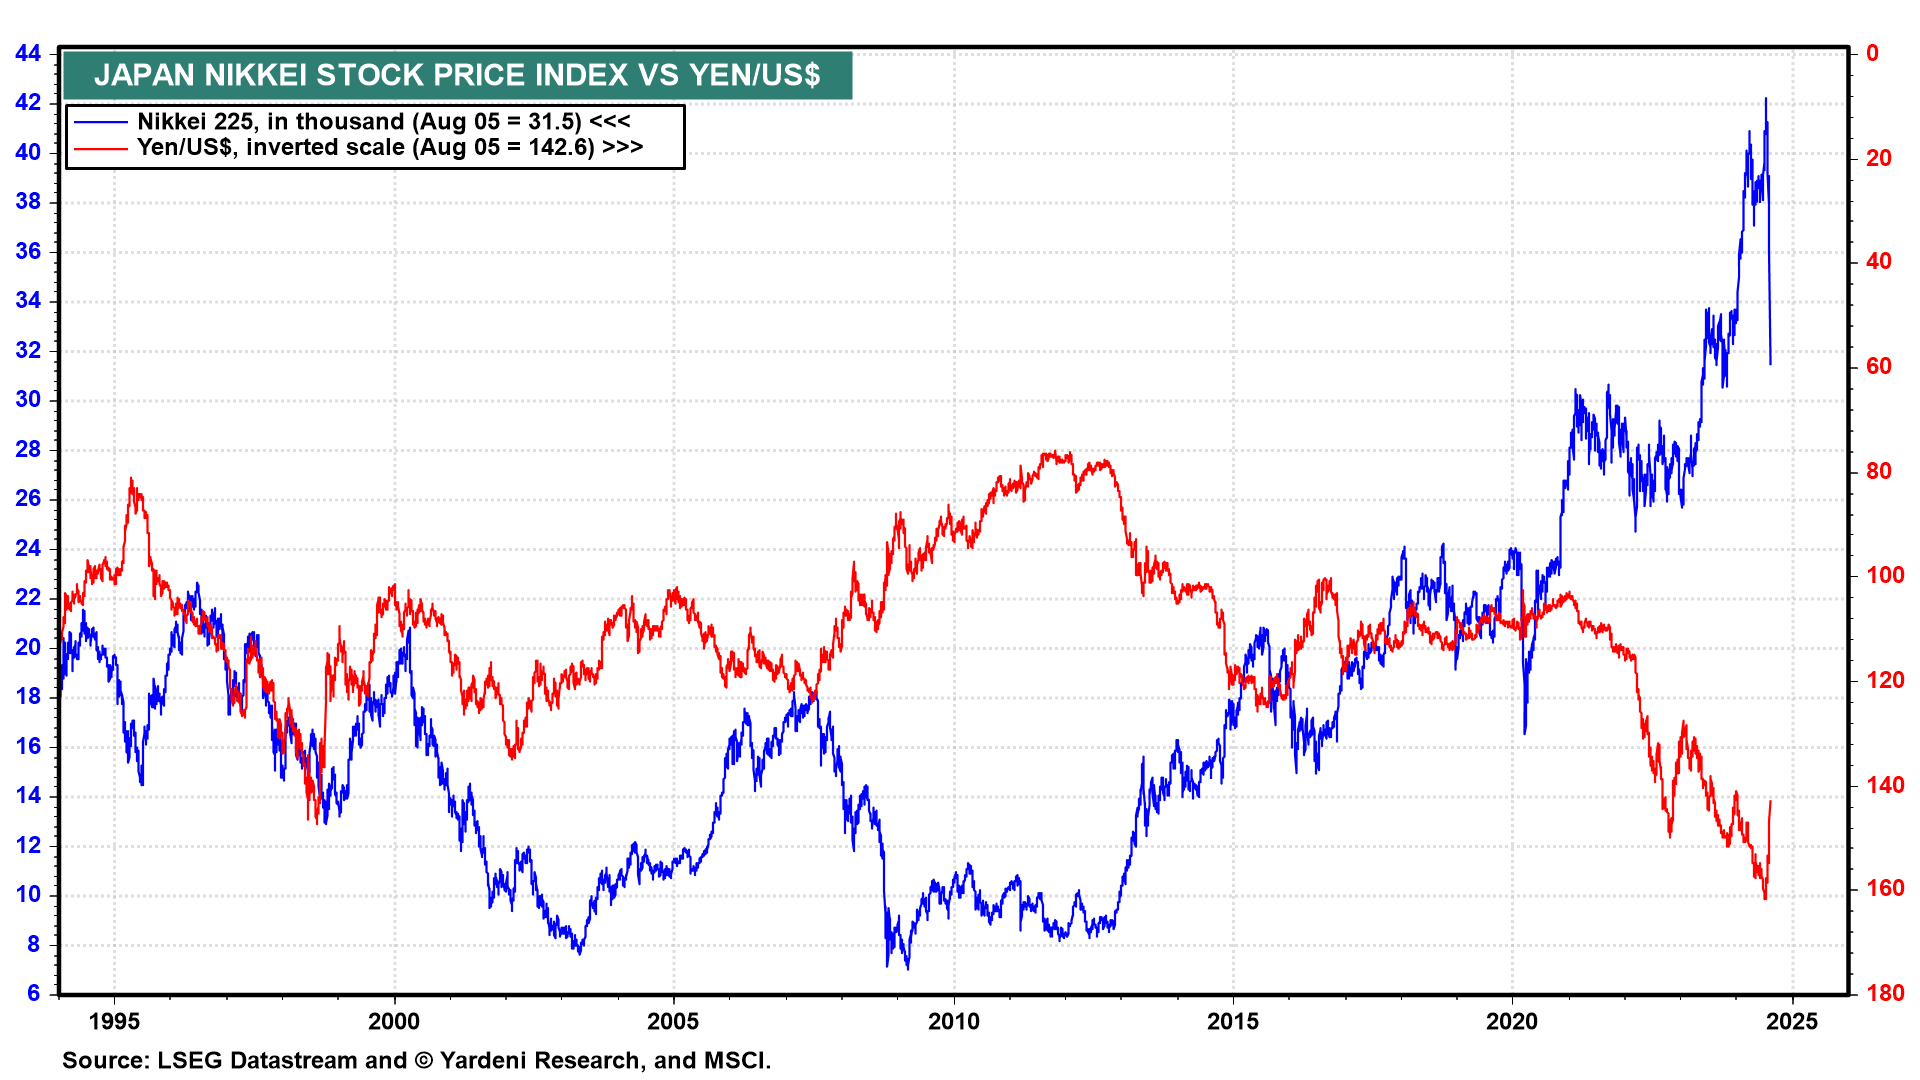
This morning, US stocks and bonds were quick to price in Japan's stock market carnage overnight. Tokyo's Nikkei stock price index fell more than 12%, its worst day since "Black Monday" in October 1987, as the yen surged to 142 against the dollar (chart). This time, the crash was in carry trades financed in Japan. In 1987, it was so-called portfolio insurance in the US. The 1987 selloff was a quick one without a recession. Might the current selloff be quick this time without a recession? We think so.
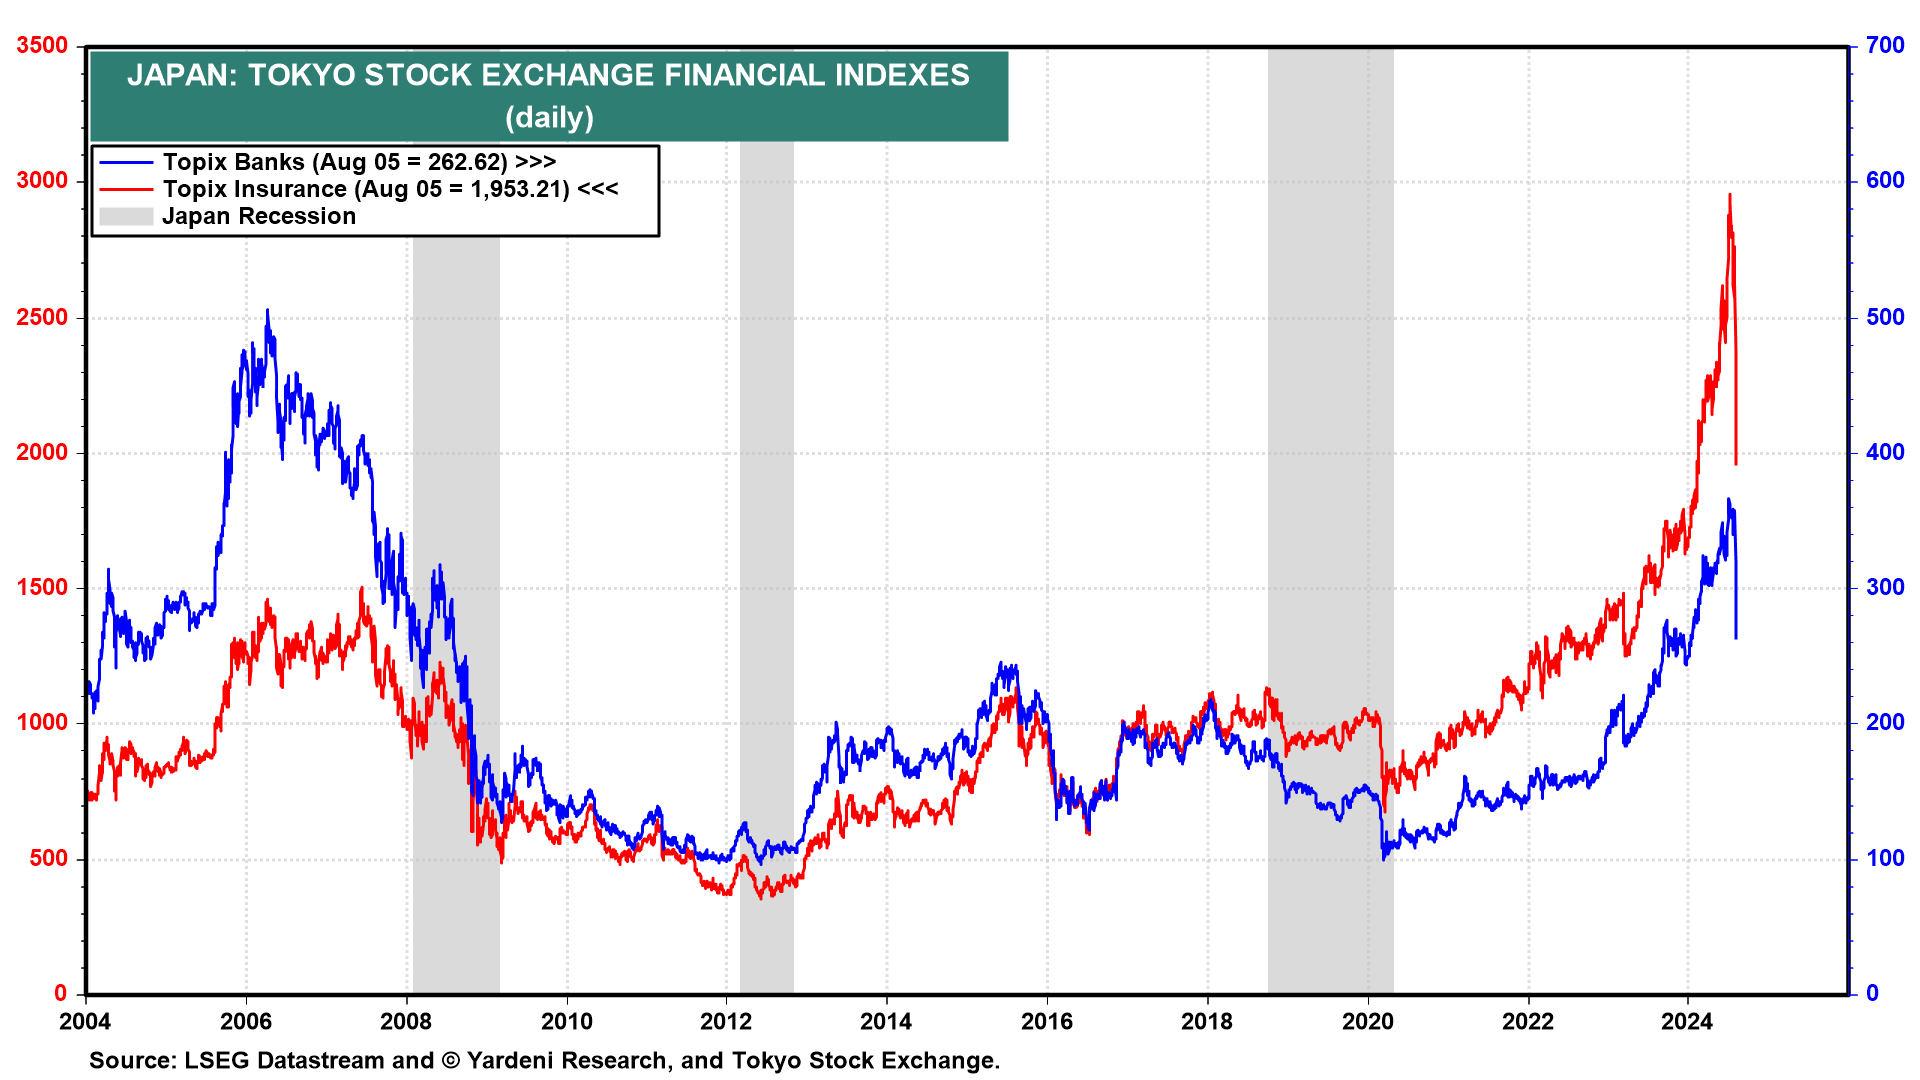
We're closely monitoring, Japan's Topix banks and insurance stock price indexes which plummeted last night (chart). This evening they've rebounded 10.1% and 14.5%. The markets must be figuring that the Bank of Japan won't be in a rush to tighten further given the adverse financial reaction to its recent restrictive stance.
Here in the US:
(1) Treasury bonds. The bond market didn't confirm the weak-economy scenario being priced into stocks. The 10-year Treasury yield sank to 3.67% in the morning. It rose to 3.85% this evening. We expect it to climb back above 4.00% in the coming weeks as recession fears fade and investors rotate back into equities.
(2) Credit. The yield spread between high-yield and US Treasury bonds widened recently but barely to 377bps, and remains historically low (chart). If the market panic had to do with recession fears, this spread would widen to at least 600-700bps.
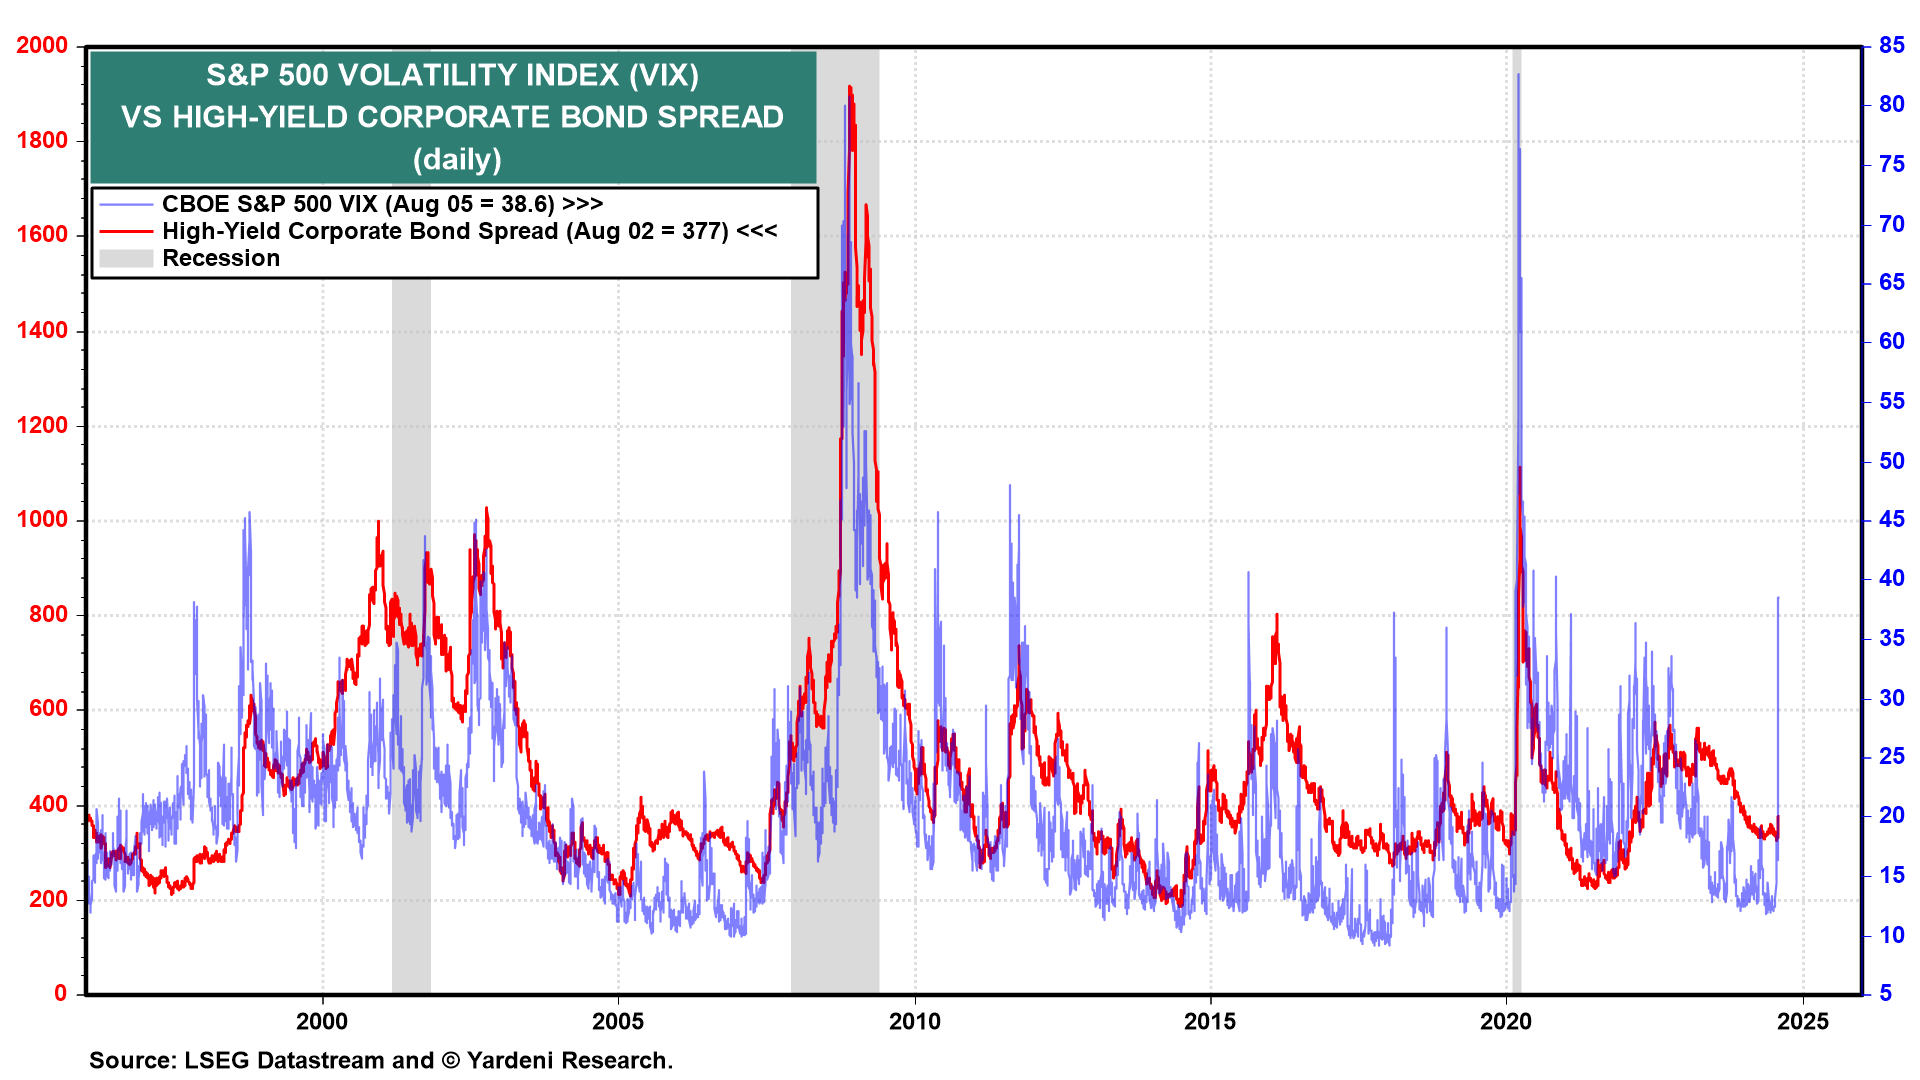
(3) VIX. The CBOE Volatility Index (VIX) did spike to 65 during the day before it settled around 39 (chart above). The VIX and credit spreads tend to be highly correlated, both rising during selloffs. Their divergence today suggests much of the rise in equity volatility had to do with the buildup of short volatility trades. Selling volatility is another popular carry trade that's grown sizably over the past few years, and also one that looks like it just unwound.
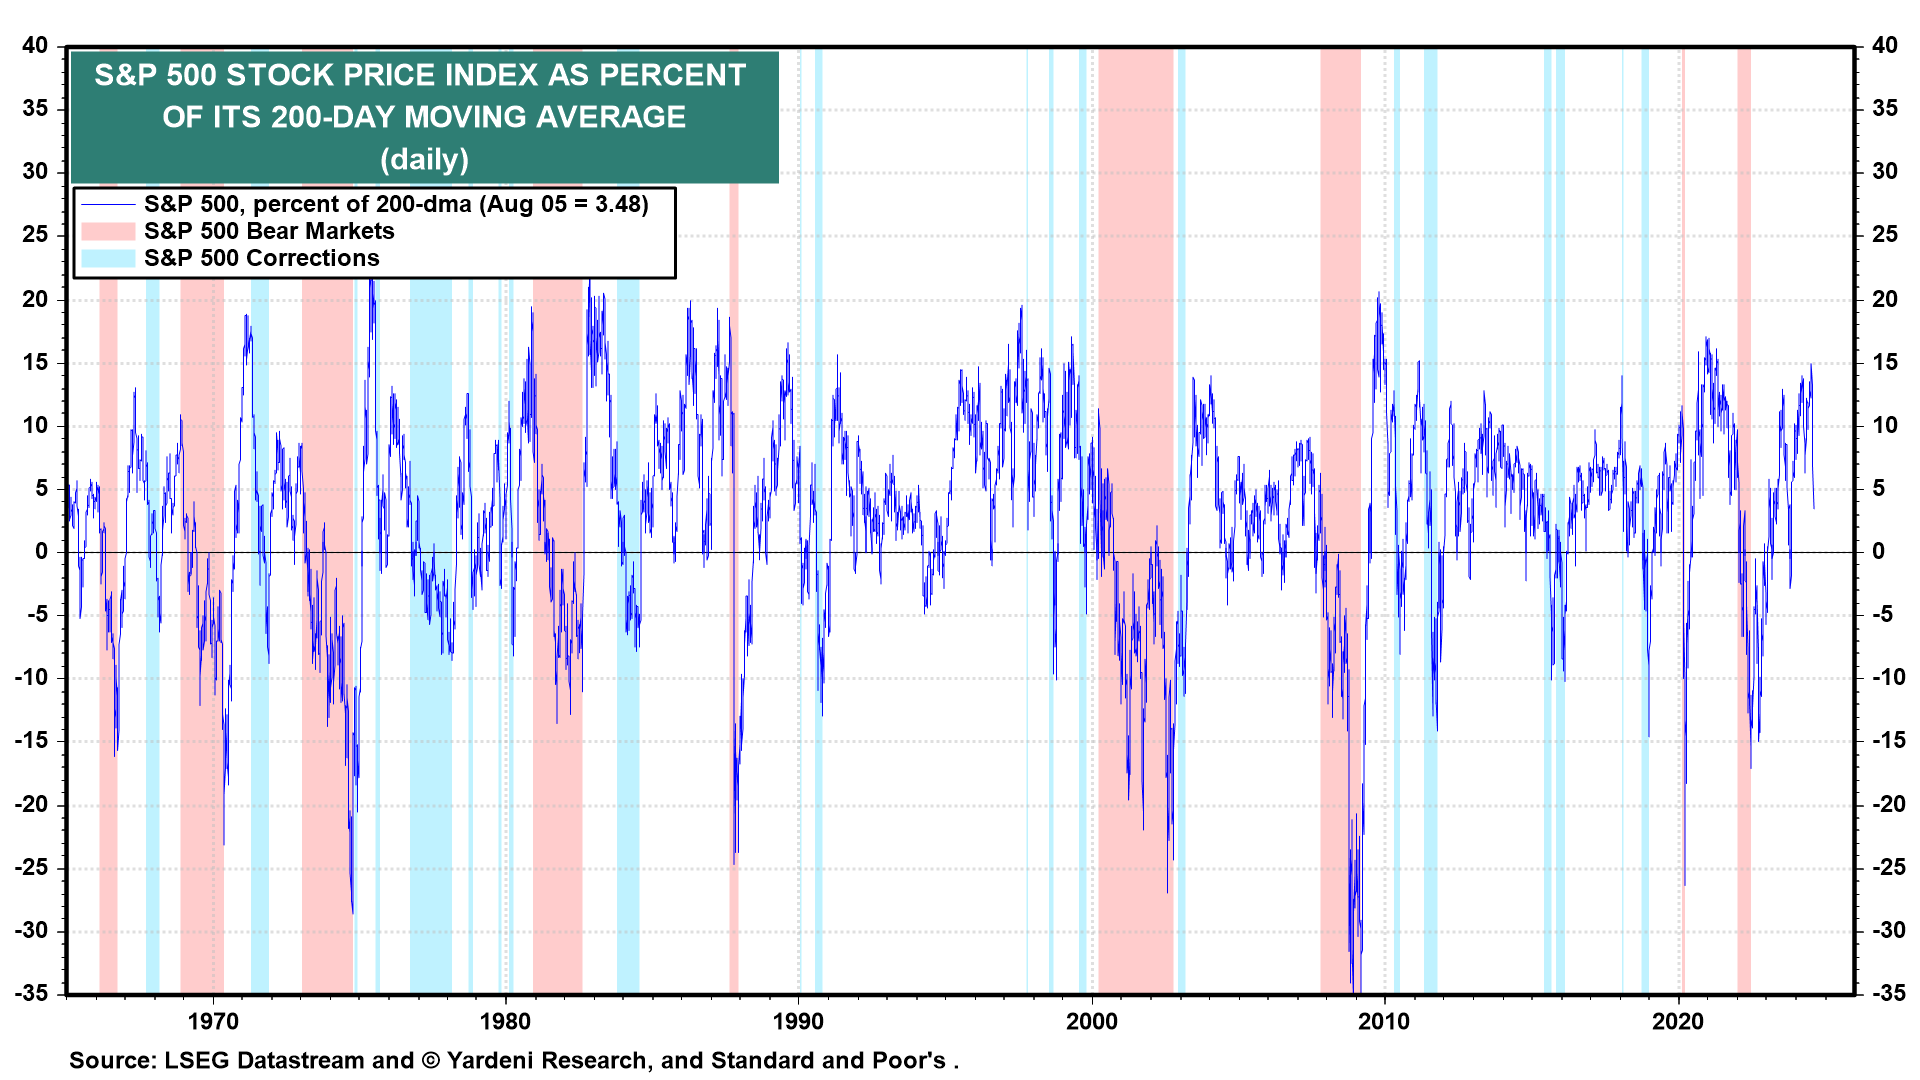
(4) Momentum. Corrections, particularly from all-time highs, happen from time to time. The S&P 500 is still just 8.5% below its record high of 5,667 on July 16. On that date, the S&P 500 exceeded its 200-day moving average by 15%, an overbought level that has often been followed by selloffs (chart). Today, that spread was down to 3.5%. We expect to see a big drop in the Investors Intelligence Bull/Bear Ratio for this week when it is released on Wednesday.
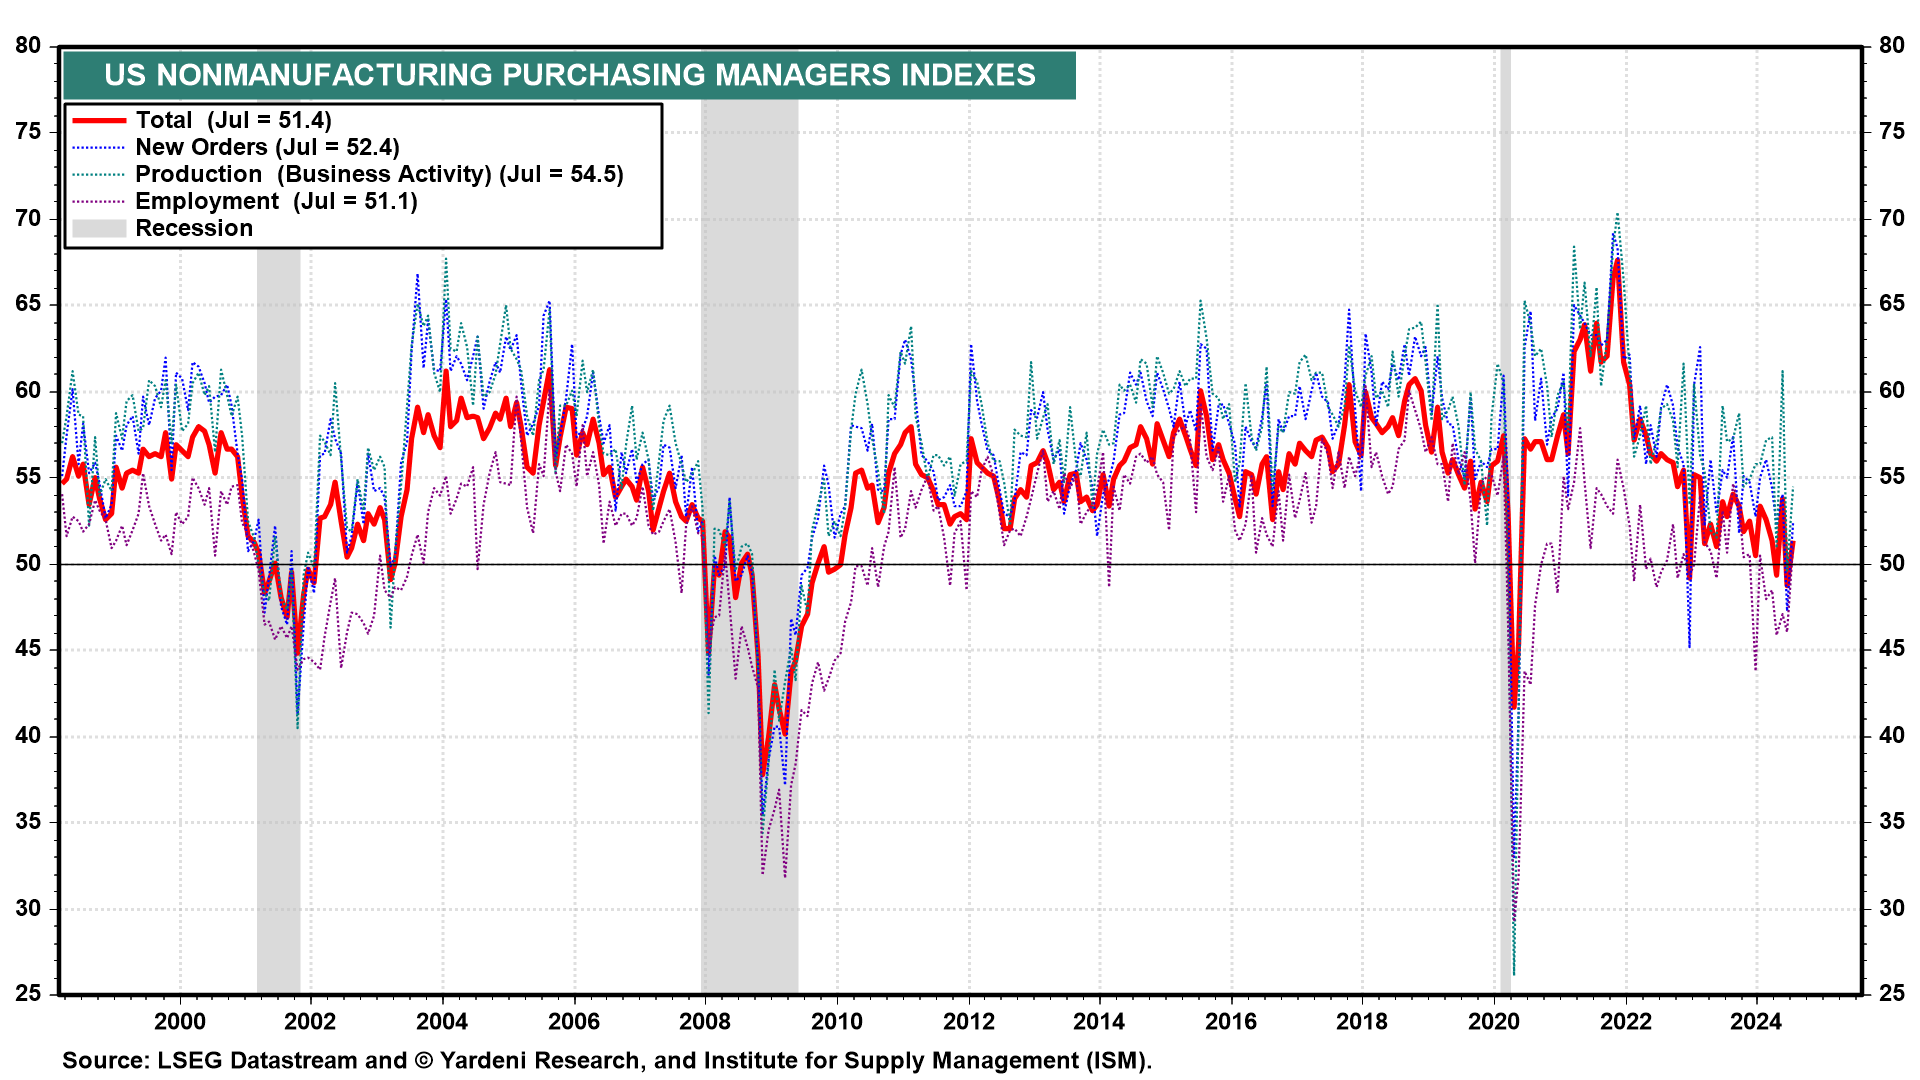
(5) Purchasing managers survey. The stock market selloff eased a bit this morning after July's ISM NM-PMI report showed the index back above 50.0 at 51.4, with the employment component notably jumping 5.0 points to 51.1 (chart). If initial unemployment claims fall on Thursday, as we expect, that should revive confidence in the economy's resilience and reduce fears of a recession.
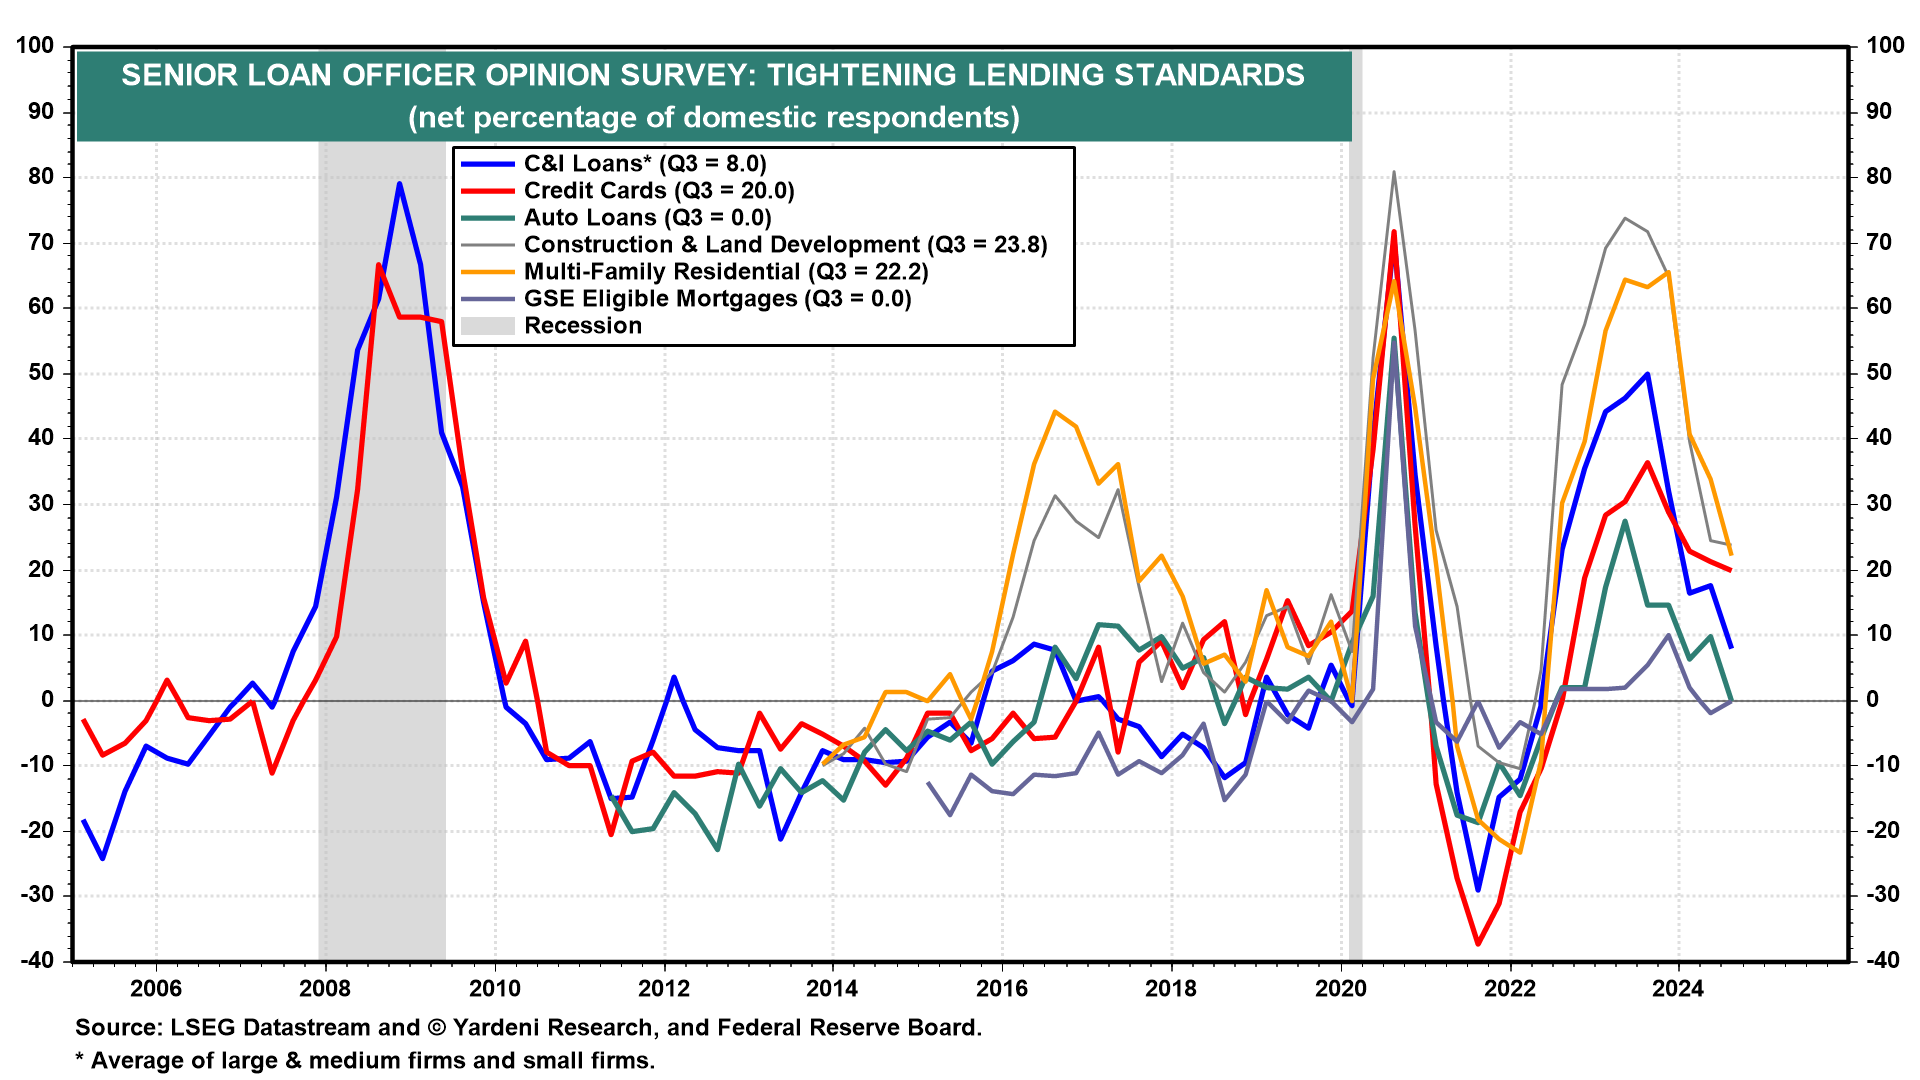
(6) Senior Loan Officer Opinion Survey (SLOOS). The Fed's Q3 SLOOS was upbeat, showing that banks are no longer increasing rates on loans, loan demand is starting to pick up, and few banks are tightening their lending standards (chart). None of this is consistent with an economic recession.
Markets were quick to price in up to 200bps of federal funds rate (FFR) cuts over the next 12 months. We don't think the Fed will be that responsive to this pullback unless a global credit crunch results from the yen carry trade unwind. We are sticking with just one cut in September for the rest of this year. No recession. No bear market. This too shall pass.