We have nothing to fear but nothing to fear. The Fed is done tightening. The economy is doing fine. Inflation is moderating. The stock market is hitting record highs. So what's wrong with this picture? Nothing other than it is the consensus view, and ours too. Today, there are lots of happy bulls, including us. We would be happier if there were fewer bulls.
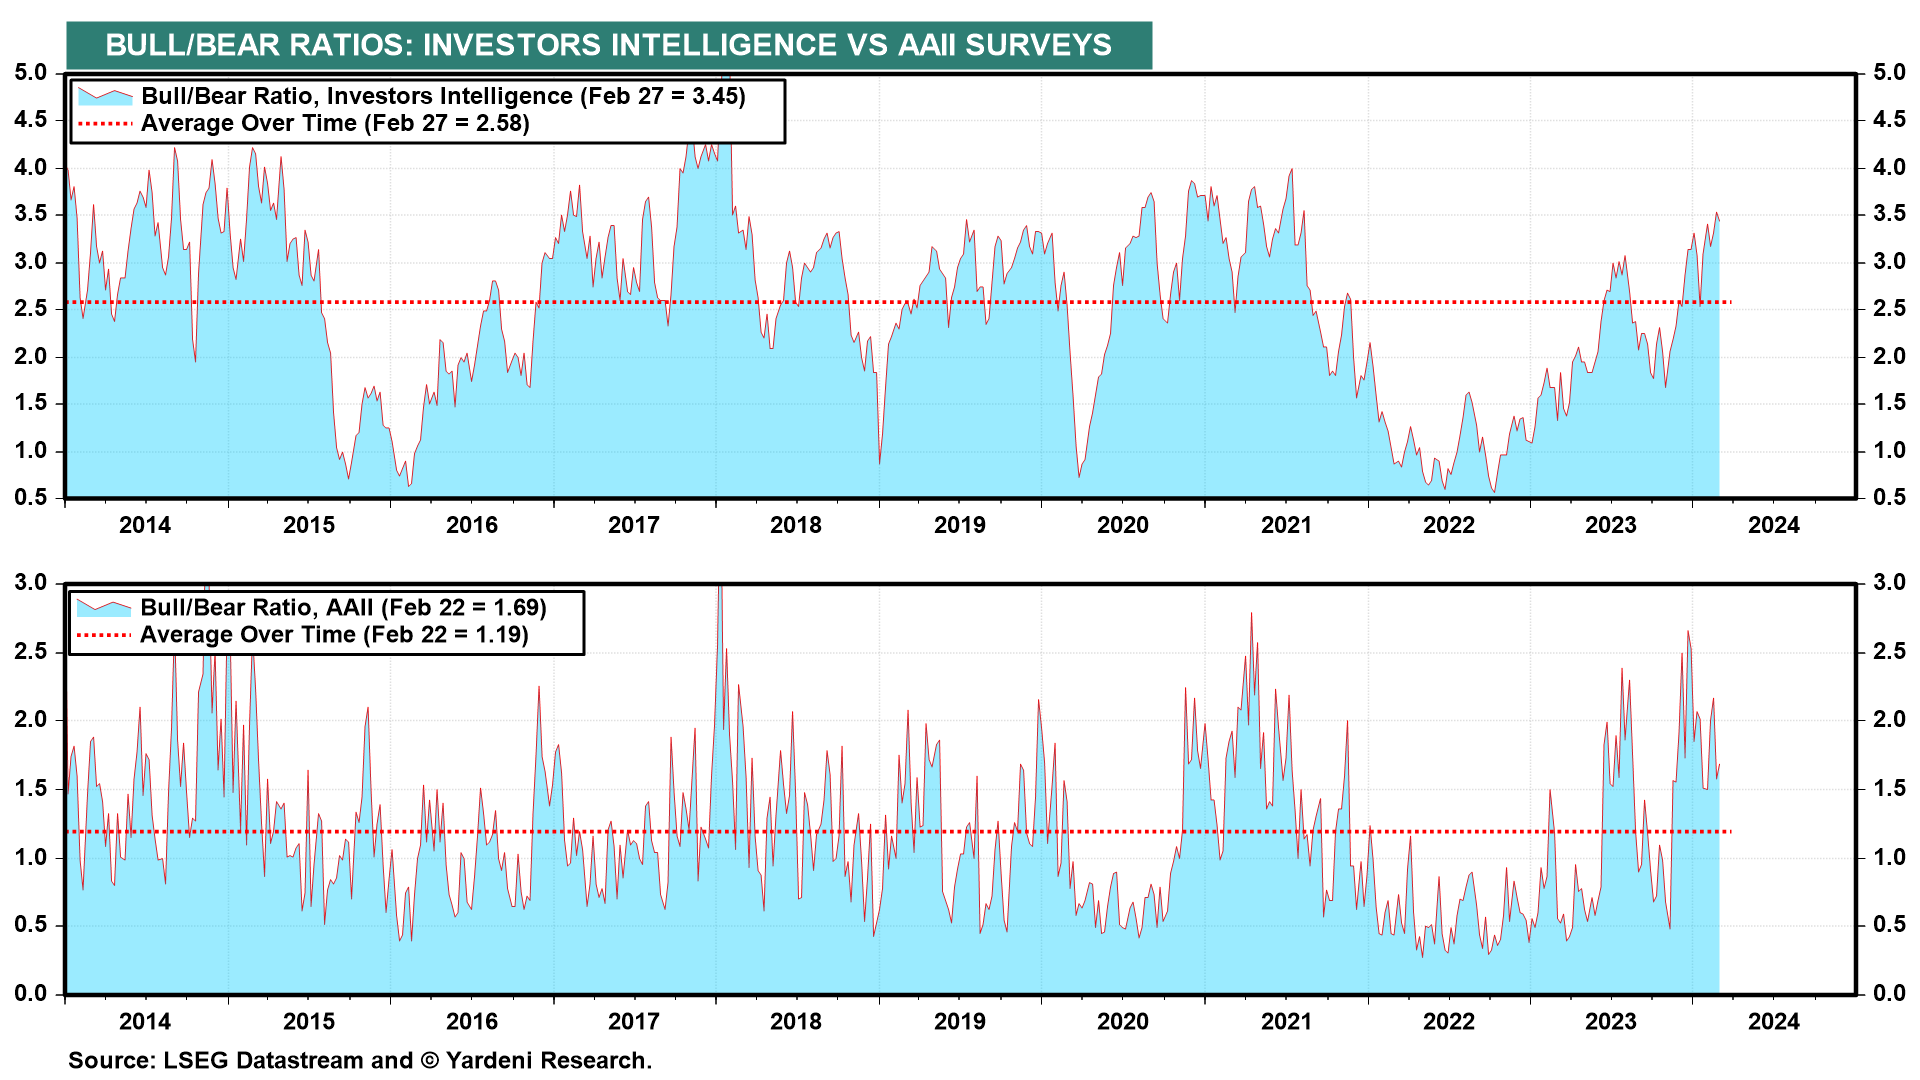
Last week, Investors Intelligence Bull/Bear Ratio rose to 3.54, the highest since the start of the current bull market (chart). This week, it edged down to 3.45. In our experience, this ratio works better as a contrarian buy signal when it is below 1.00 than as a contrarian sell signal when it is above 3.50.

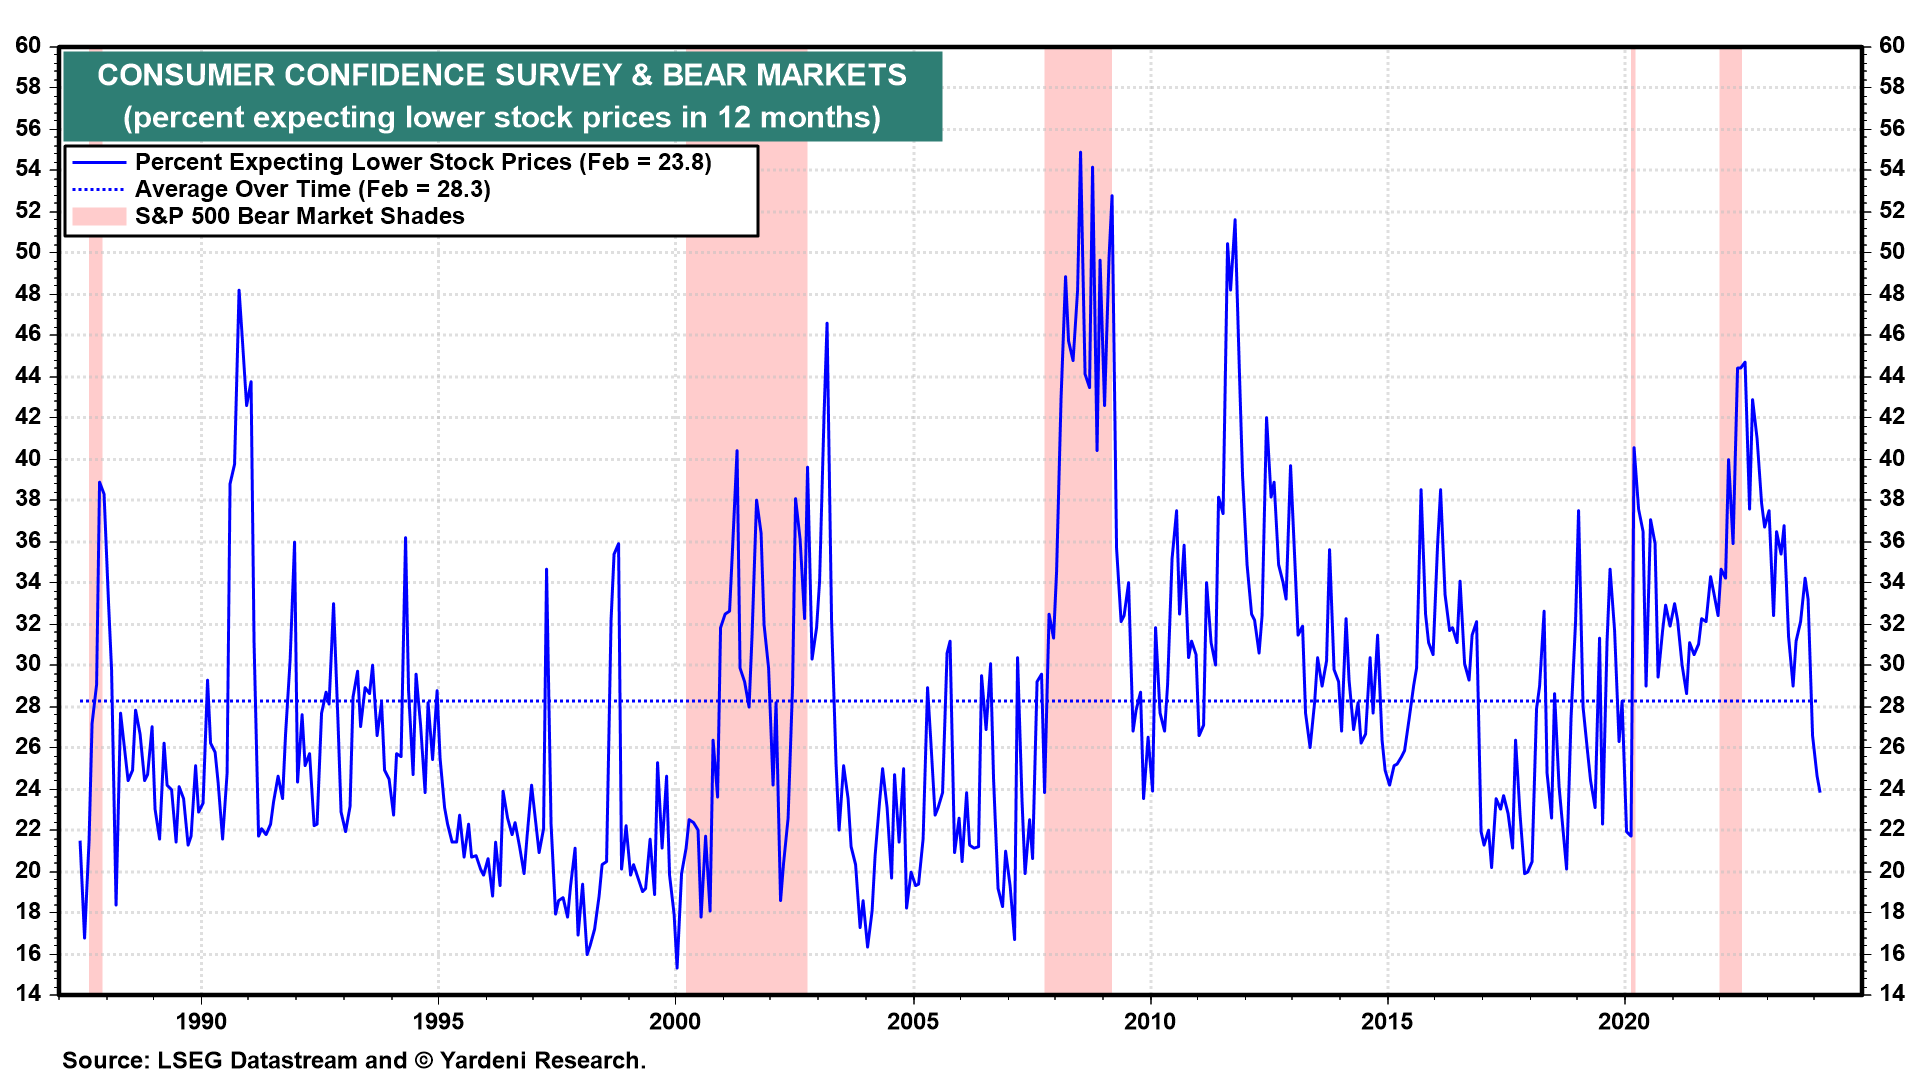
A similar stock market sentiment index is a monthly time series in the consumer confidence survey (chart). It shows the percent of respondents expecting stock prices to be lower in 12 months. During February, it stood at 23.8%. That's a very low reading and probably includes mostly permabears. This sentiment indicator also works better as a contrarian buy signal when it is over 40% or so.

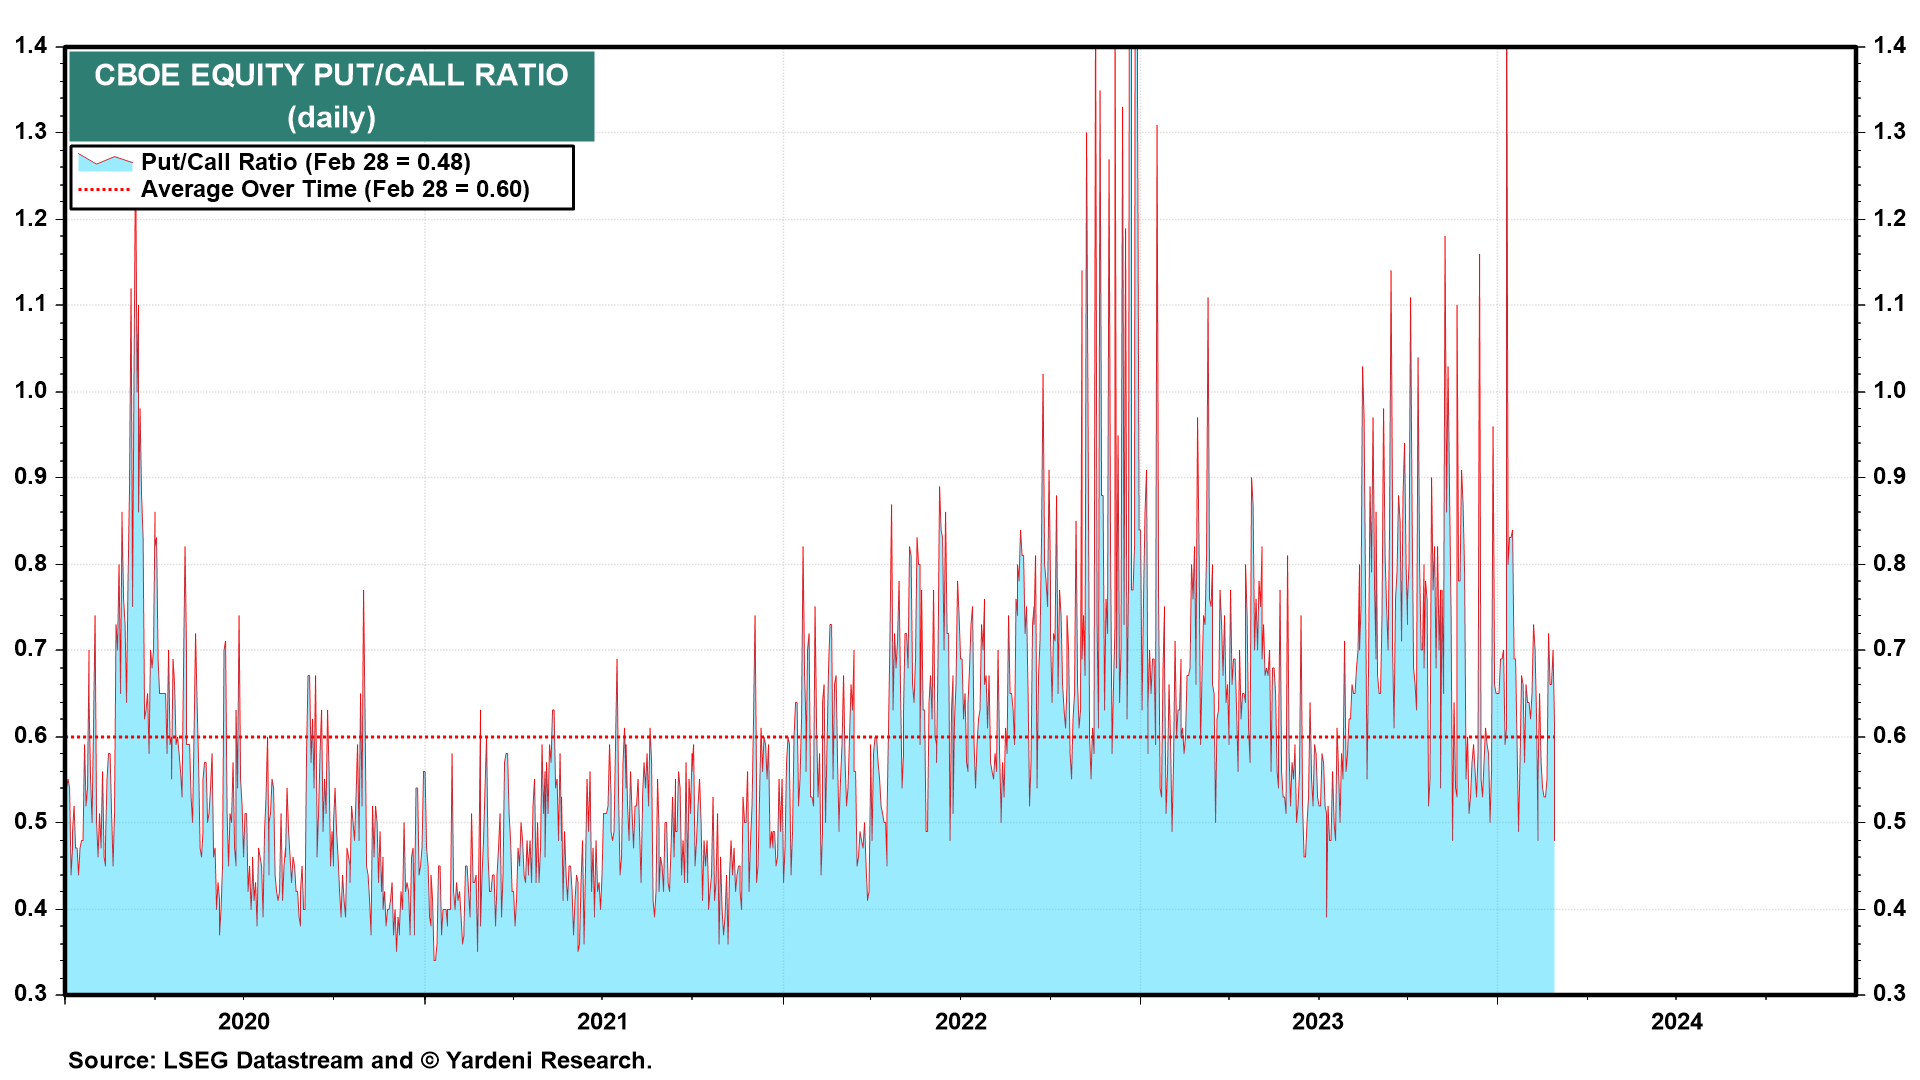
Also showing no fear is the Put/Call Ratio (chart). It was 0.48 today, below its average over time of 0.60. This indicator works better for day traders than for investors.

A small correction in the S&P 500 probably won't do much to tamp down bullishness. If the market continues to move higher despite the contrarian sell signals reviewed above, that might indicate that a meltup is underway.
Meanwhile, retail investors are piling into equity ETFs. That partly explain the outperformance of the MegaCap-8. As their share of the market's capitalization has gone up, they've benefitted more than other stocks from inflows into equity ETFs. This feedback loop may be another sign of a meltup.


