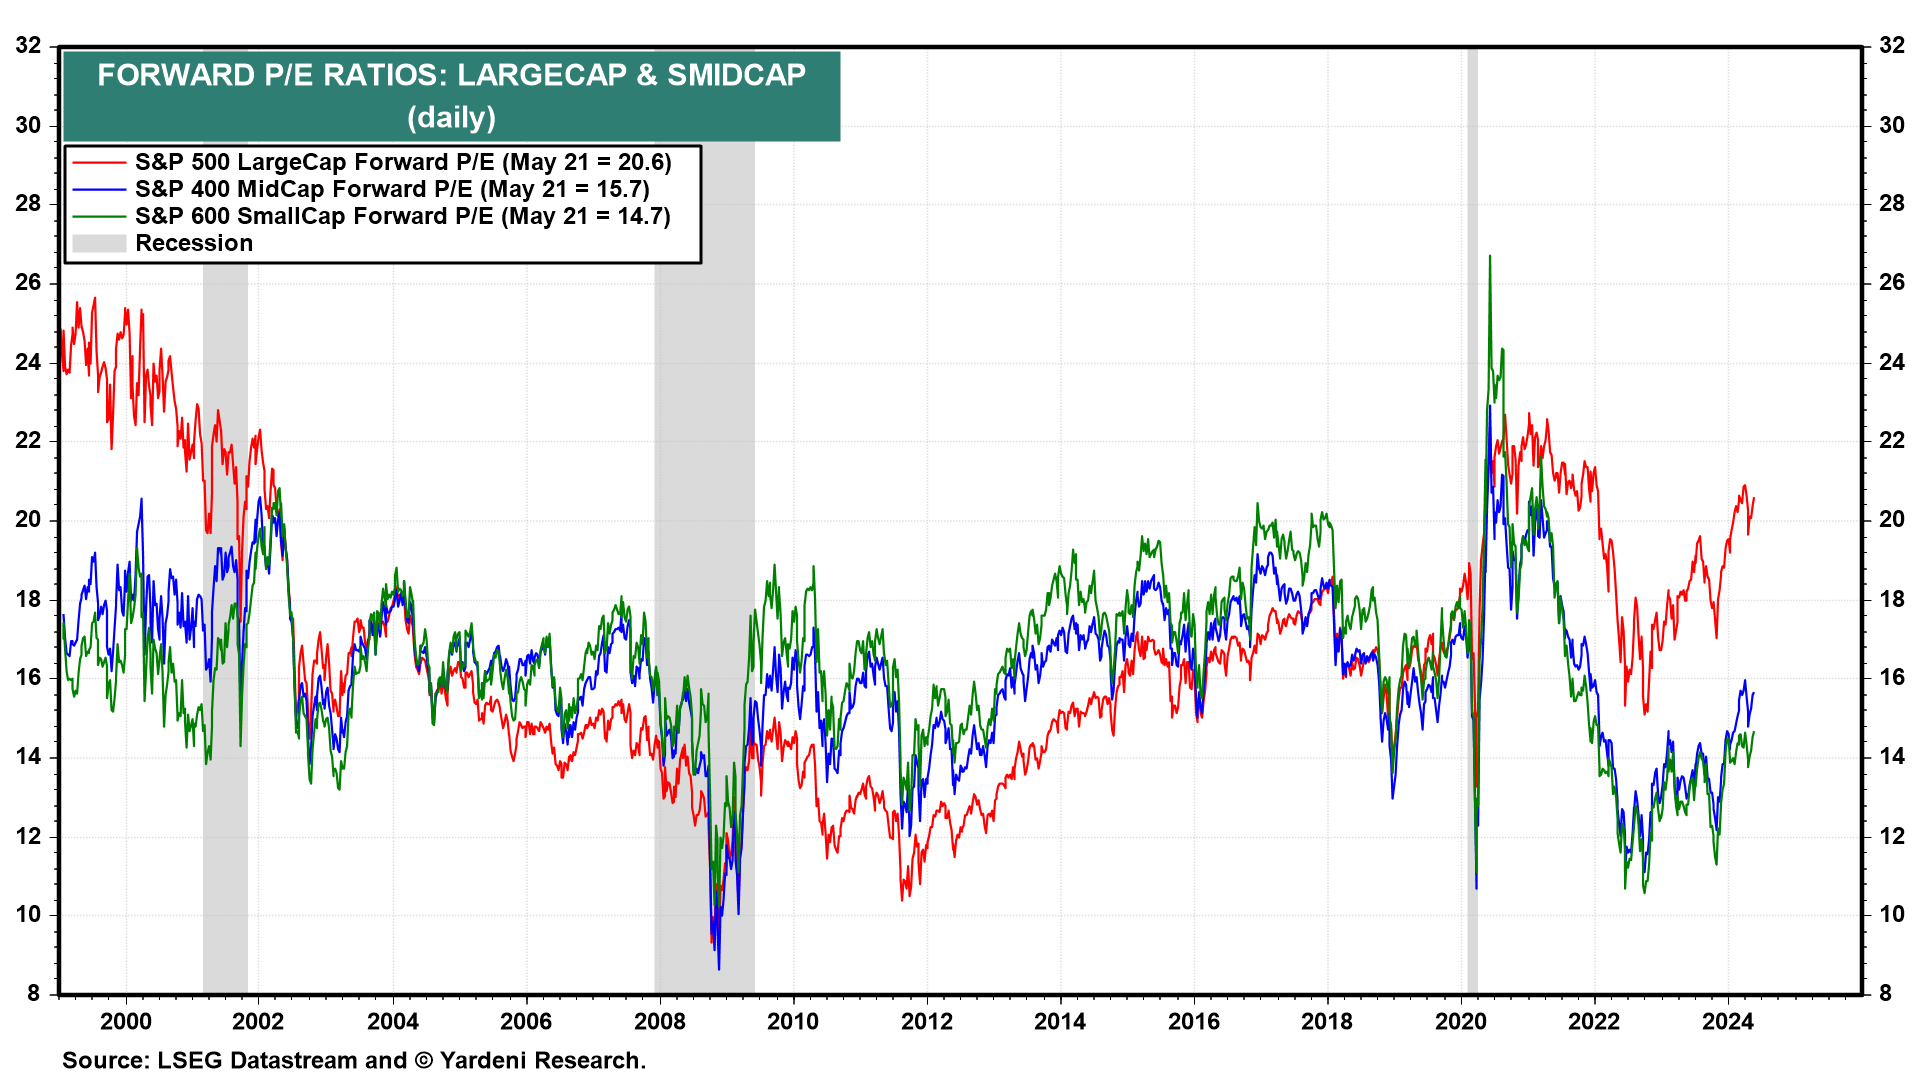
Why has the S&P 500 LargeCaps stock price index been more expensive than the indexes for the S&P 400 MidCaps and S&P 600 SmallCaps since the pandemic (chart)? From around 2005 until about 2019, the forward P/E of the S&P 500 had mostly been below the forward P/Es of the SMidCaps (chart). The last time that LargeCaps sported higher P/Es than the SMidCaps was during the Tech bubble of the late 1990s and early 2000s.

Obviously, the MegaCap-8 have boosted the forward P/E of the S&P 500 in recent years, especially since the pandemic because they were deemed to be among the few beneficiaries of the calamity. Since late 2022, they've been associated with the AI revolution. At the same time, since early 2023, SMidCaps have been viewed as more significant casualties of the Fed's tightening of monetary policy and the Fed's current higher-for-longer stance on interest rates.
Many of the smaller companies have floating-rate debt and they tend to have higher leverage than bigger companies. Both the S&P 500 and S&P 400 are at record highs, while the S&P 600 has remained stalled below its late 2021 record high (chart).


