


Are stock market valuations too high? There is no obvious answer to the valuation question. So we are dependent on history for some guidance. We don’t have to go very far back in time to find a meltup that looks similar to the current one. The obvious analogy is to that of the late 1990s:
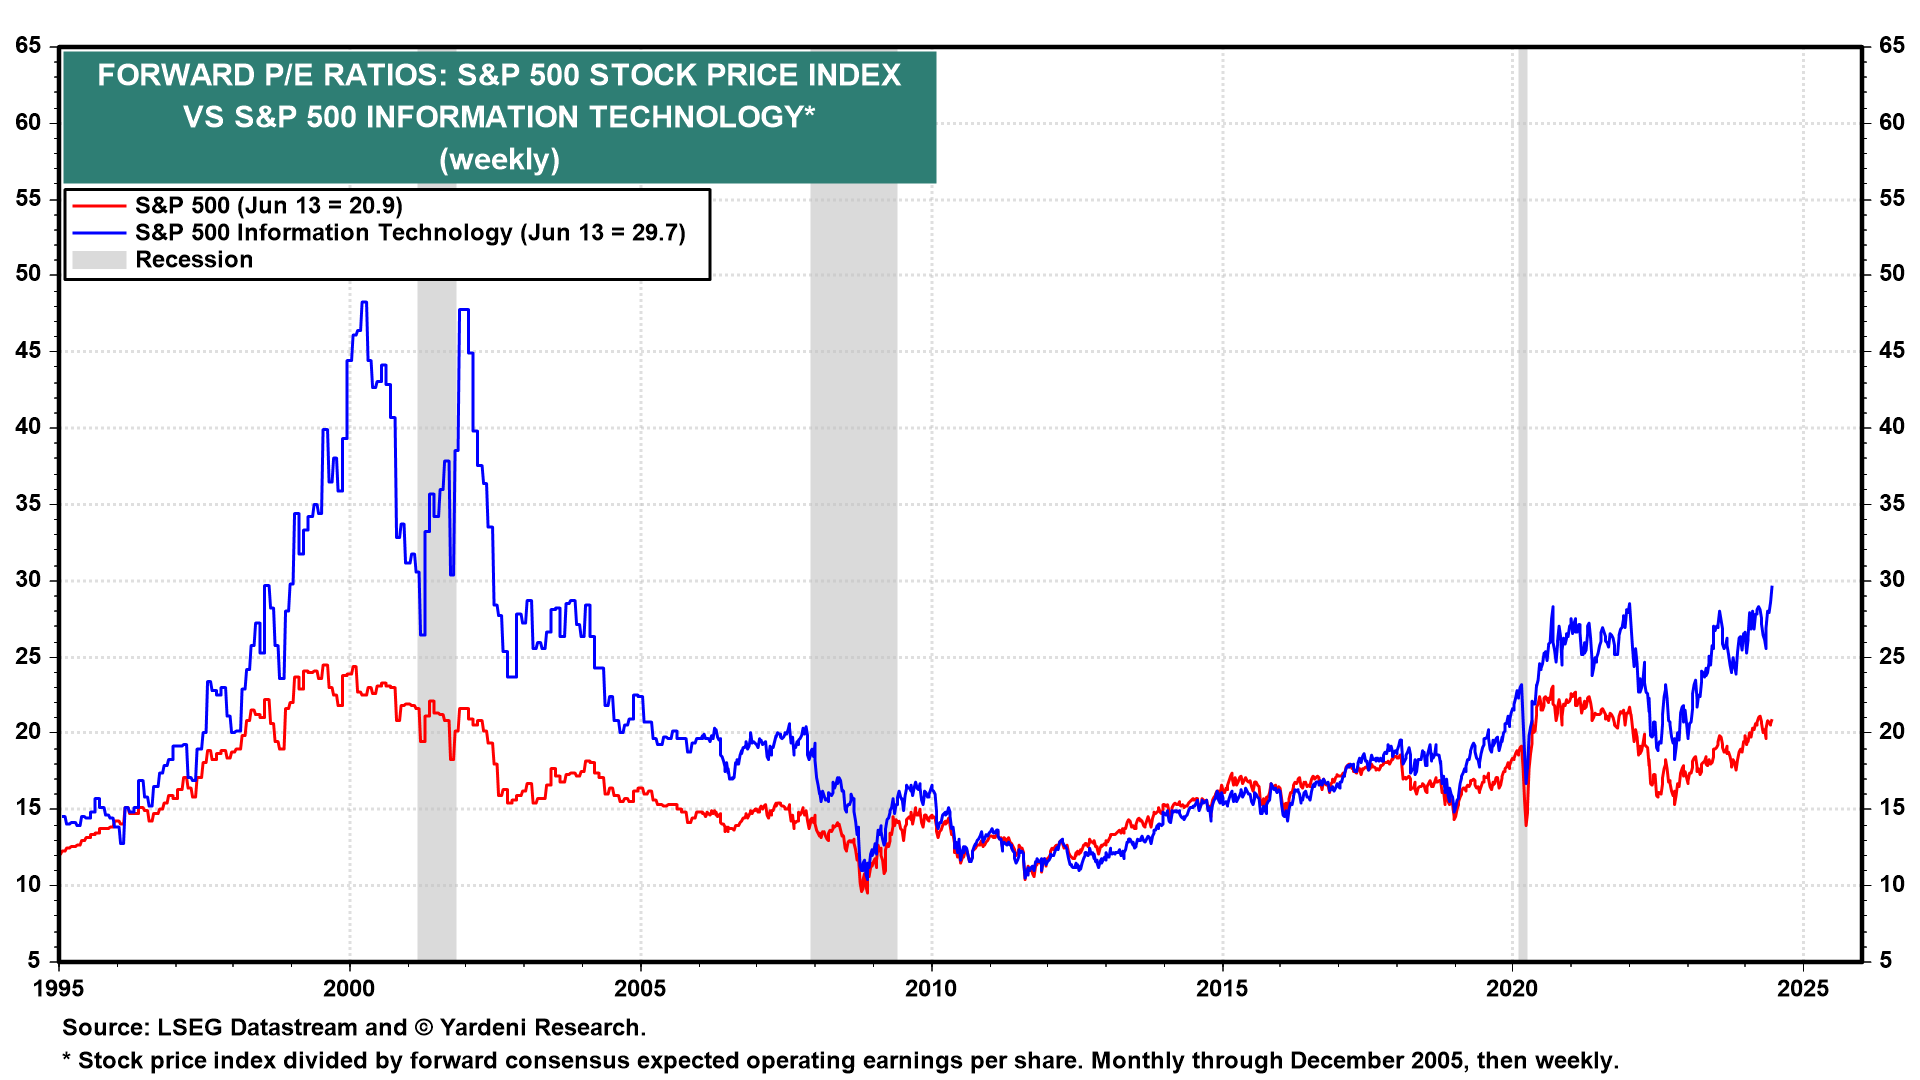
(1) Valuation multiples, now & then. The S&P 500 peaked at a forward P/E of 24.5 during the week of August 13, 1999 (chart). The S&P 500 would rise to 6600 by the end of this year at that multiple with forward earnings at $270 per share. That could happen again if the S&P 500's meltup continues to be led by the index’s Information Technology sector, as it was back in the late 1990s. The sector’s forward P/E soared from 30.0 at the start of 1999 to 48.3 during the week of March 14, 2000. The sector’s current forward P/E is 30.0.
(2) Market capitalization & earnings shares, now & then. The Information Technology sector plus the Communication Services sector combined now account for a whopping 41.6% of the market capitalization of the S&P 500 (chart). That’s as high as they got just before the Tech bubble burst in early 2000. Then again, these two sectors currently account for 33.0% of the S&P 500’s forward earnings compared to just under 24.0% when the Tech Wreck started in 2000, arguably helping to justify so high a multiple—or at least more so than it was justified back then.