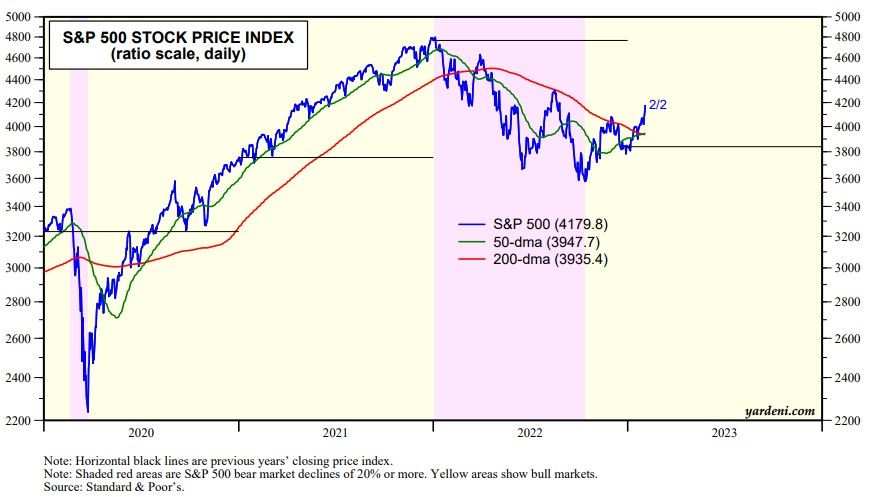
The S&P 500 blasted higher through its 200-day moving average over the past few days (chart). The four previous attempts to break out of this average failed. This one should succeed. The S&P 500's 50-day moving average has just risen slightly above its 200-day moving average, which may be bottoming now.

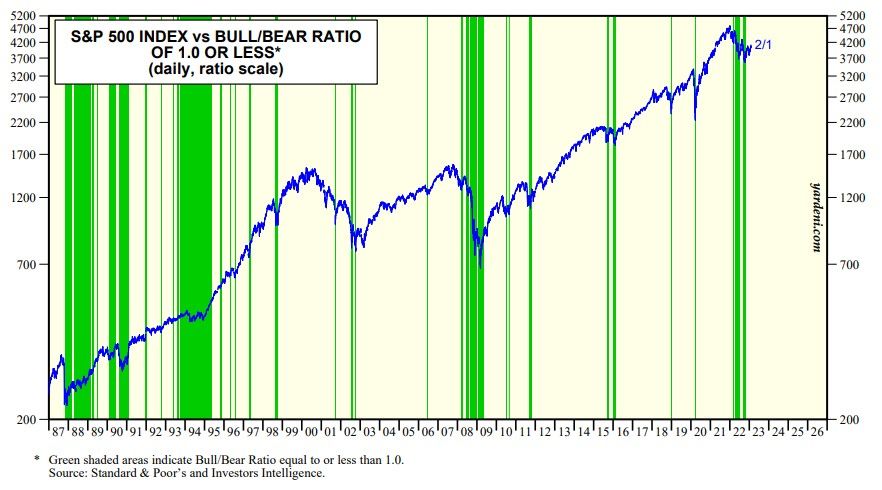
Last summer and fall we observed that the Investors Intelligence Bull/Bear Ratio (BBR) was as bearish as it was during the tail end of the Great Financial Crisis in early 2009. During last year's bear market, the BBR fell below 1.0 numerous times (chart). We noted that such readings have a history of providing excellent buy signals for contrarian investors.

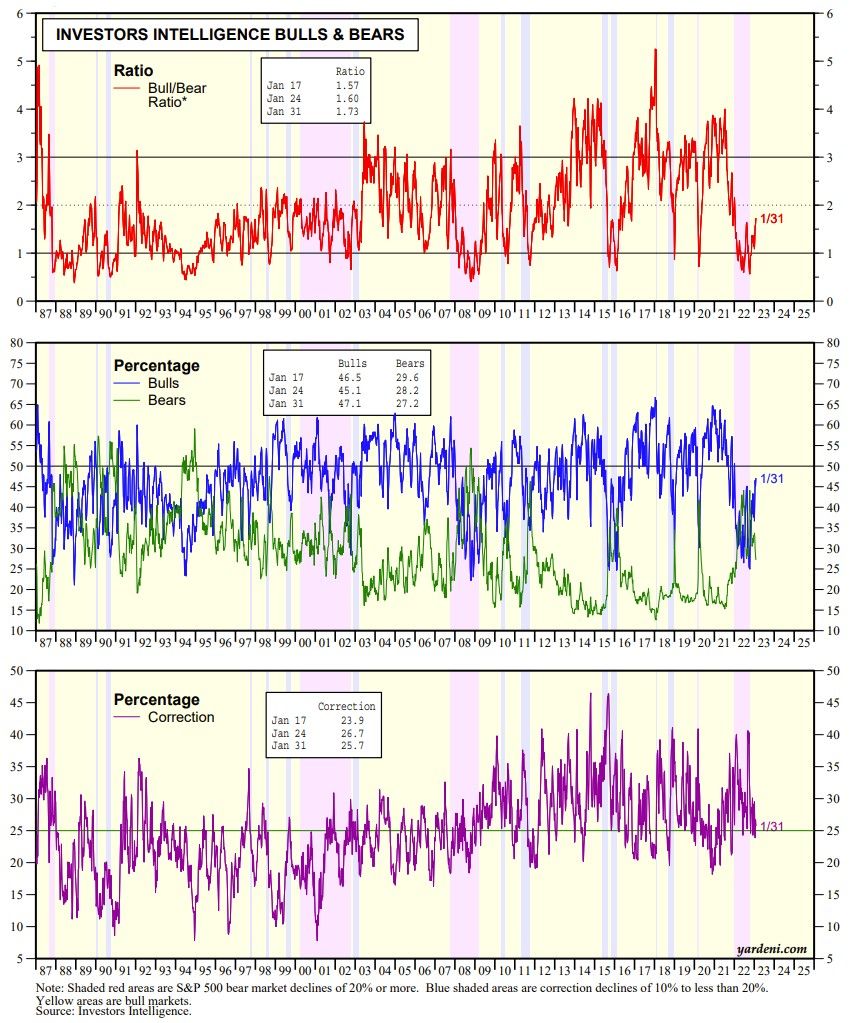
In recent weeks, the BBR has risen above 1.00 to 1.73 during the January 31 week. That's consistent with early bull market readings (chart).


