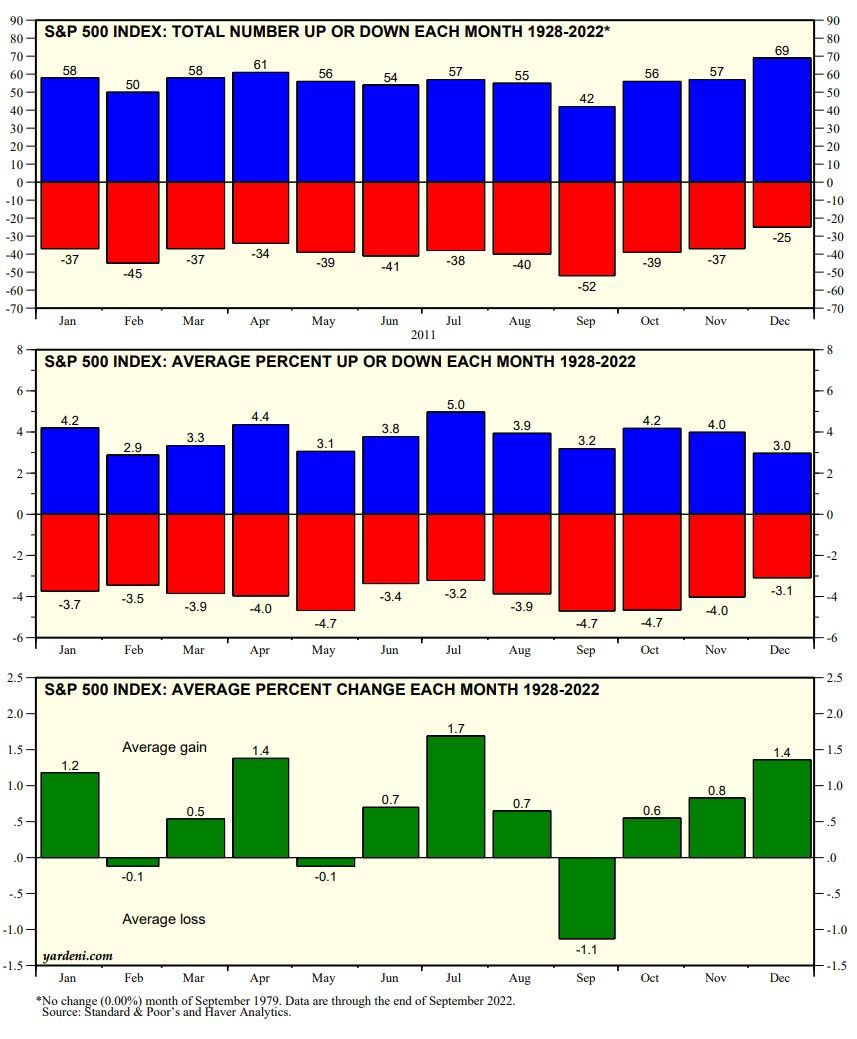
Since 1928, Decembers have had more up months and fewer down months for the S&P 500 than any other month of the year (chart). The average change in the S&P 500 during Septembers has been -1.1%, the worst of the months. That was followed by October (0.6%), November (0.8%), and December (1.1%). Yes, Virginia, there is a Santa Claus rally.

Santa's sled may face more turbulence than usual during December. Tomorrow, Fed Chair Jerome Powell may continue to squawk like a hawk in a speech at the Brookings Institution. The next batch of employment reports (i.e., ADP and JOLTS tomorrow and BLS on Friday) should show that the labor market remains tight, keeping upward pressure on wage inflation. November's CPI will be released on December 13, the same day that the next 2-day meeting of the FOMC occurs. It should confirm that inflation peaked during the summer.
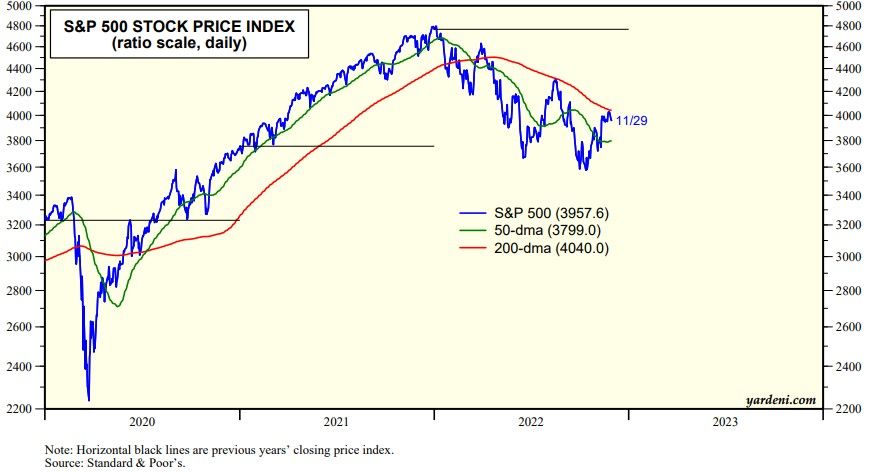
Technicians will be watching the S&P 500, which was back up to its 200-day moving average last week, but failed to take it out (chart). If Powell sounds less like the Grinch Who Stole Christmas tomorrow, then a breakout to the August 16 high of 4305 is likely by the end of the year.


