The S&P 500 fell 23.6% from January 3 to June 16. It is up 5.4% since then through Friday's close. Is this just a short-covering rally in a bear market? We will be discussing this topic in Monday's Morning Briefing. For now consider the following:
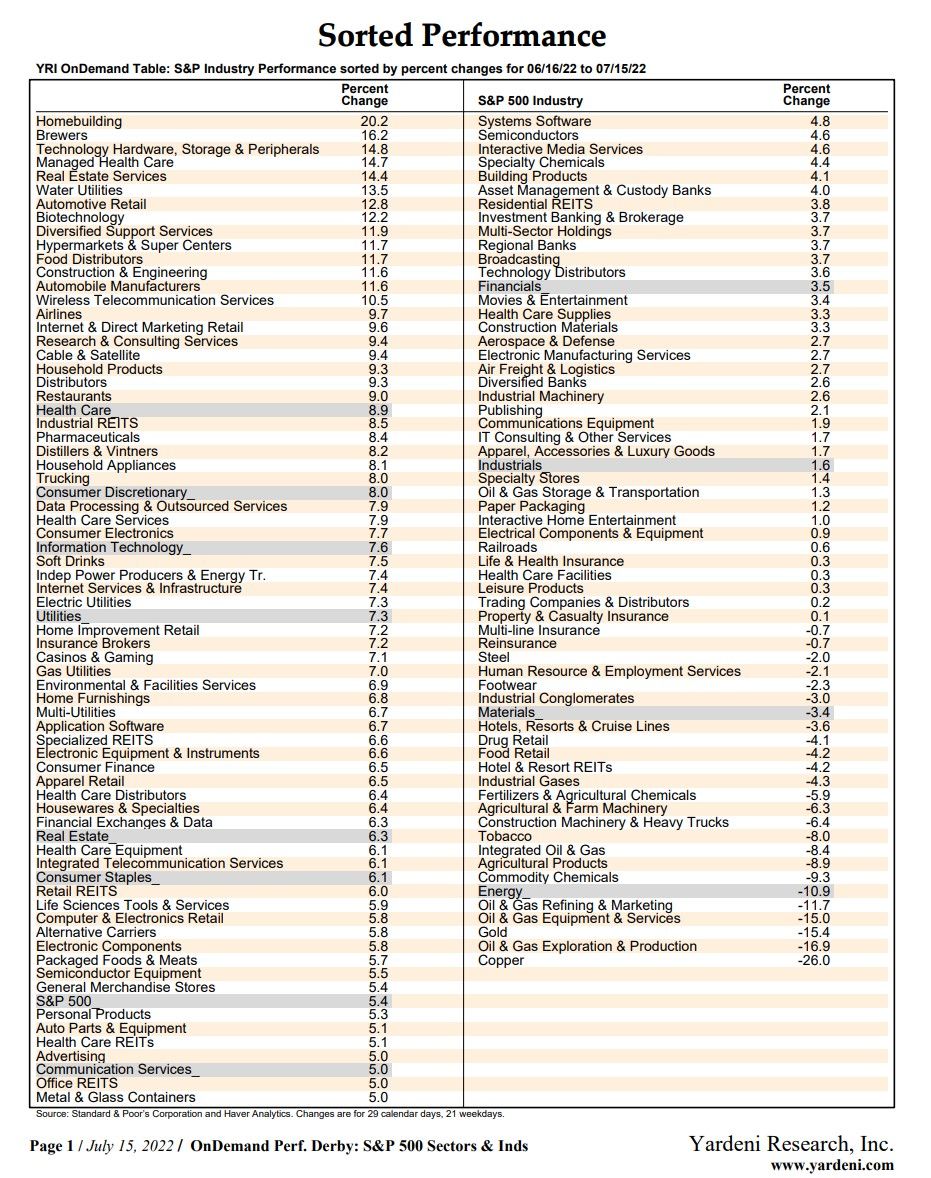
(1) So far, the stock market’s rally since June 16 has been led by the biggest losers during the bear market from January 3 through June 16. Here is the performance derby of the 11 sectors of the S&P 500 from January 3 through June 16 and since then through Friday’s close sorted by the latest results (table below): Health Care (-14.4%, 8.9%), Consumer Discretionary (-36.4%, 8.0), Information Technology (-30.2, 7.6), Utilities (-8.3, 7.3), Real Estate (-24.9, 6.3), Consumer Staples (-11.2, 6.1), S&P 500 (-23.6, 5.4), Communication Services (-32.7, 5.0), Financials (-22.4, 3.5), Industrials (-18.6, 1.6), Materials (-16.5, -3.4), and Energy (35.0, -10.9).
(2) From a fundamental perspective, the reversal of fortune has been led by sectors that benefit from the fall in the bond yield from 3.48% on June 14 (two days before the market's recent bottom) to 2.92% on Friday. The laggards and outright losers since June 16 have been some of the sectors that will be harder hit than the others in a recession scenario, which is gaining credibility as the yield has fallen along with commodity prices. Yet, among the winners are Consumer Discretionary and Information Technology, which would be hurt by a recession.
(3) Among the 100+ industries we track, the biggest winner since June 16 has been Homebuilding (20.2%), while the biggest loser has been Copper (-26.0%).


