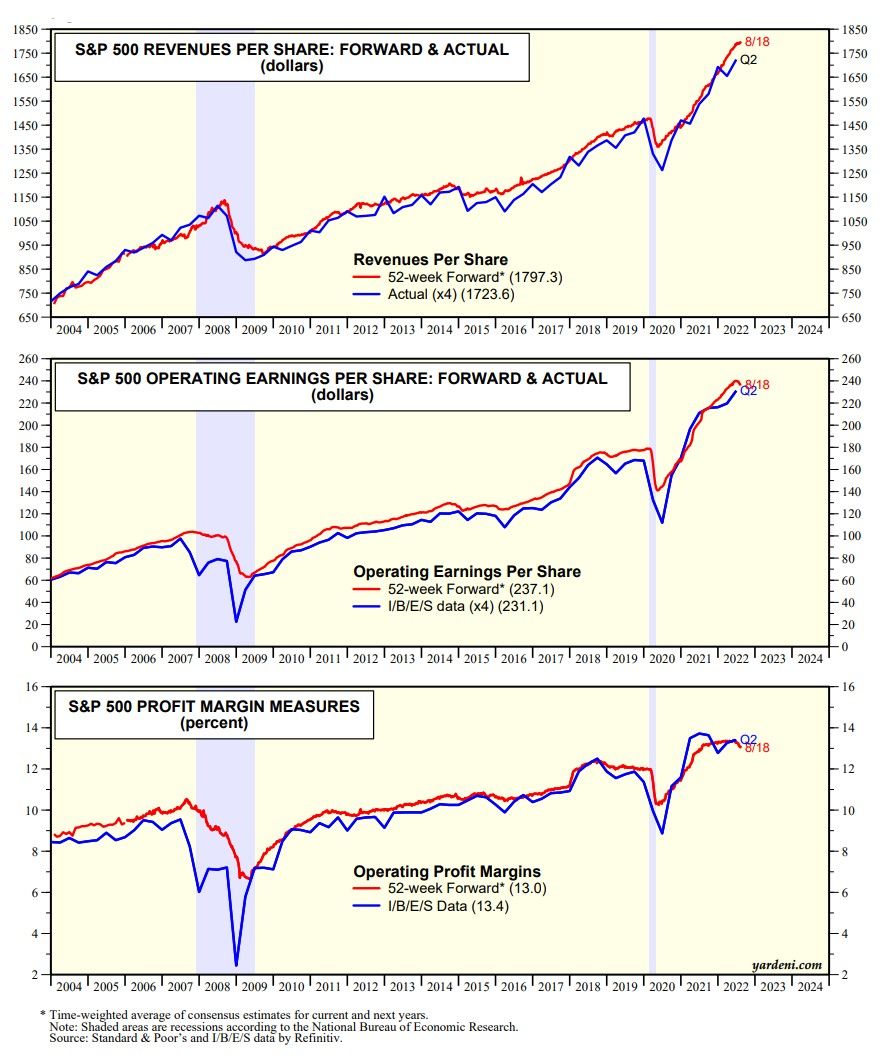
Our weekly forward metrics for S&P 500 revenues, earnings, and the profit margin continue to accurately track their quarterly counterparts (chart below). Revenues and earnings both rose to record highs during Q2, up 12.1% and 9.5% y/y, respectively. Q2 earnings per share rose to a record $231. S&P 500's profit margin was 13.4% during Q2, near recent record highs.
So why is the S&P 500 down 14.9% ytd? The index's forward P/E plunged on investors' fears that tighter monetary policy aimed at bringing inflation down will also cause a recession.
The S&P 500's weekly metrics have started to look toppy recently reflecting cautious forward guidance from company managements during the Q2 earnings season. Forward revenues is still rising, boosted by inflation in selling prices. But costs are rising faster recently squeezing the forward profit margin and weighing on earnings.
We're expecting the S&P 500 to remain in a very volatile range between the June 16 low of 3666 and the August 16 high of 4305 for the rest of this year as earnings flatten and the forward P/E bounces between 15.0 and 18.0. Yes, we still expect to see a new high in the S&P 500 next year. But, first let's get through this one.


