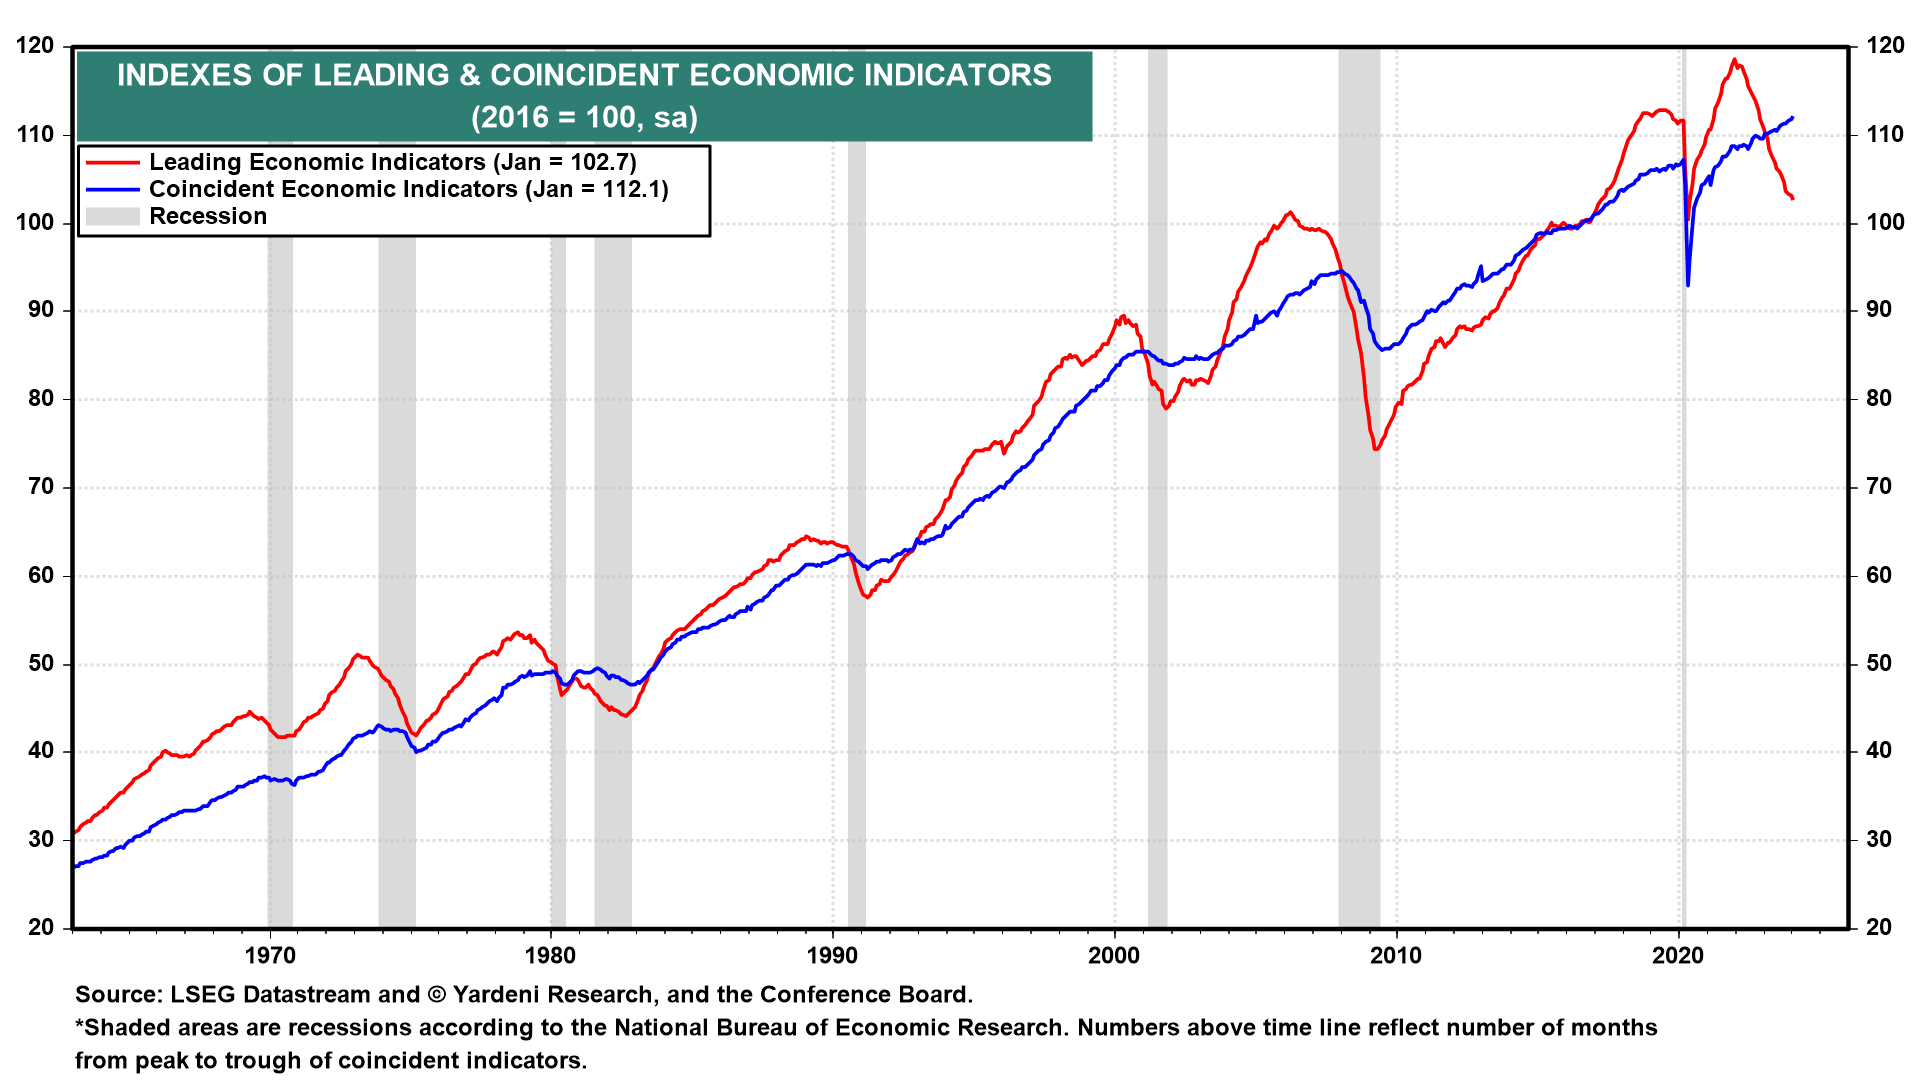
January's Index of Leading Economic Indicators (LEI) was down again by 0.4% (chart). It has been falling since December 2021. It was the 23rd straight monthly decline, just one month short of the record-long slump that began in April 2007 and ran through March 2009 during the Great Financial Crisis. January's Index of Coincident Economic indicators rose 0.2% to yet another record high, continuing to refute the recession forecast of the LEI.

The Conference Board, which compiles the two indexes, backed off its recession forecast. A spokesperson for the group said: “While the declining LEI continues to signal headwinds to economic activity, for the first time in the past two years, six out of its 10 components were positive contributors over the past six-month period (ending in January 2024).” She added. “As a result, the leading index currently does not signal recession ahead. While no longer forecasting a recession in 2024, we do expect real GDP growth to slow to near zero percent over Q2 and Q3.”
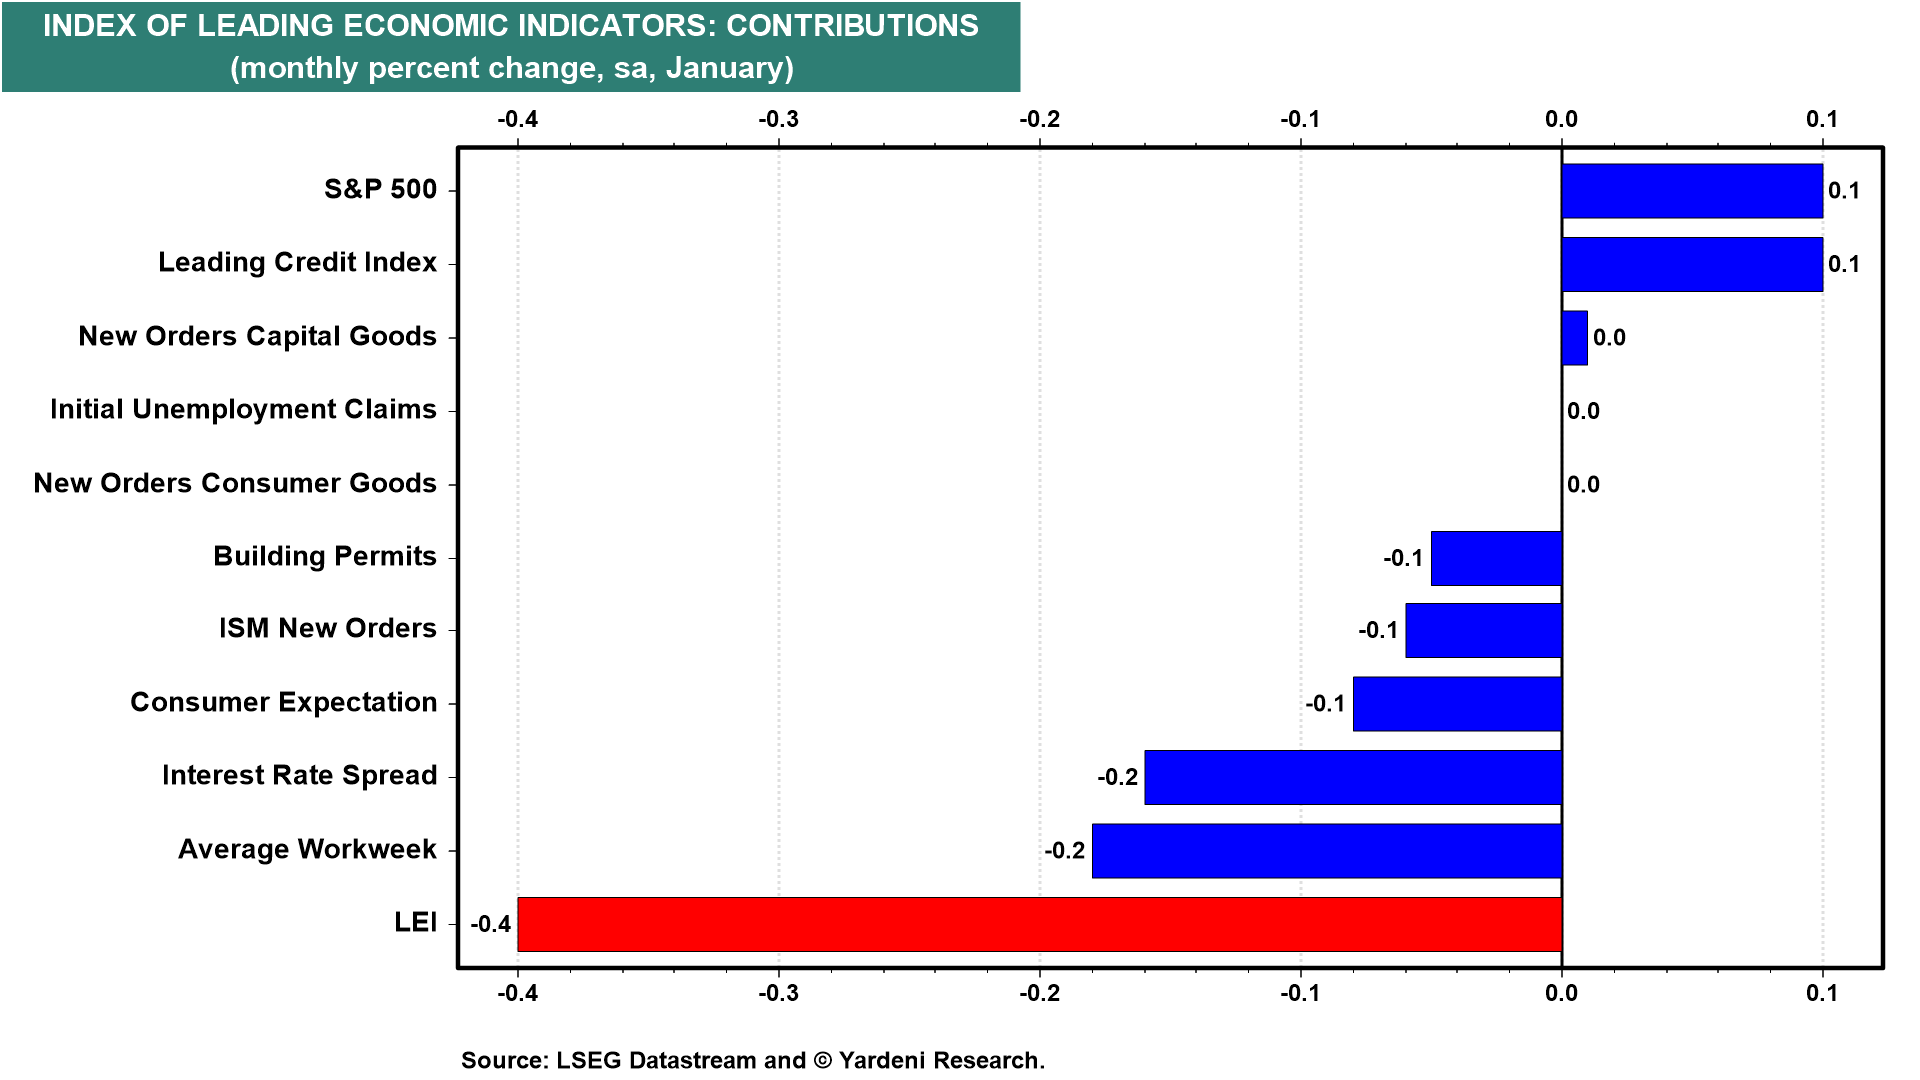
Rather than admit that the LEI has been misleading, The Conference Board tweaked the rule of thumb, which had been that three consecutive declines in the LEI signaled a looming recession. Now it's how many of its components are falling over a six month period. In our opinion, the LEI is due for a product recall. It needs to be fixed to give more weight to the services sector. Here is January's LEI contributions chart:

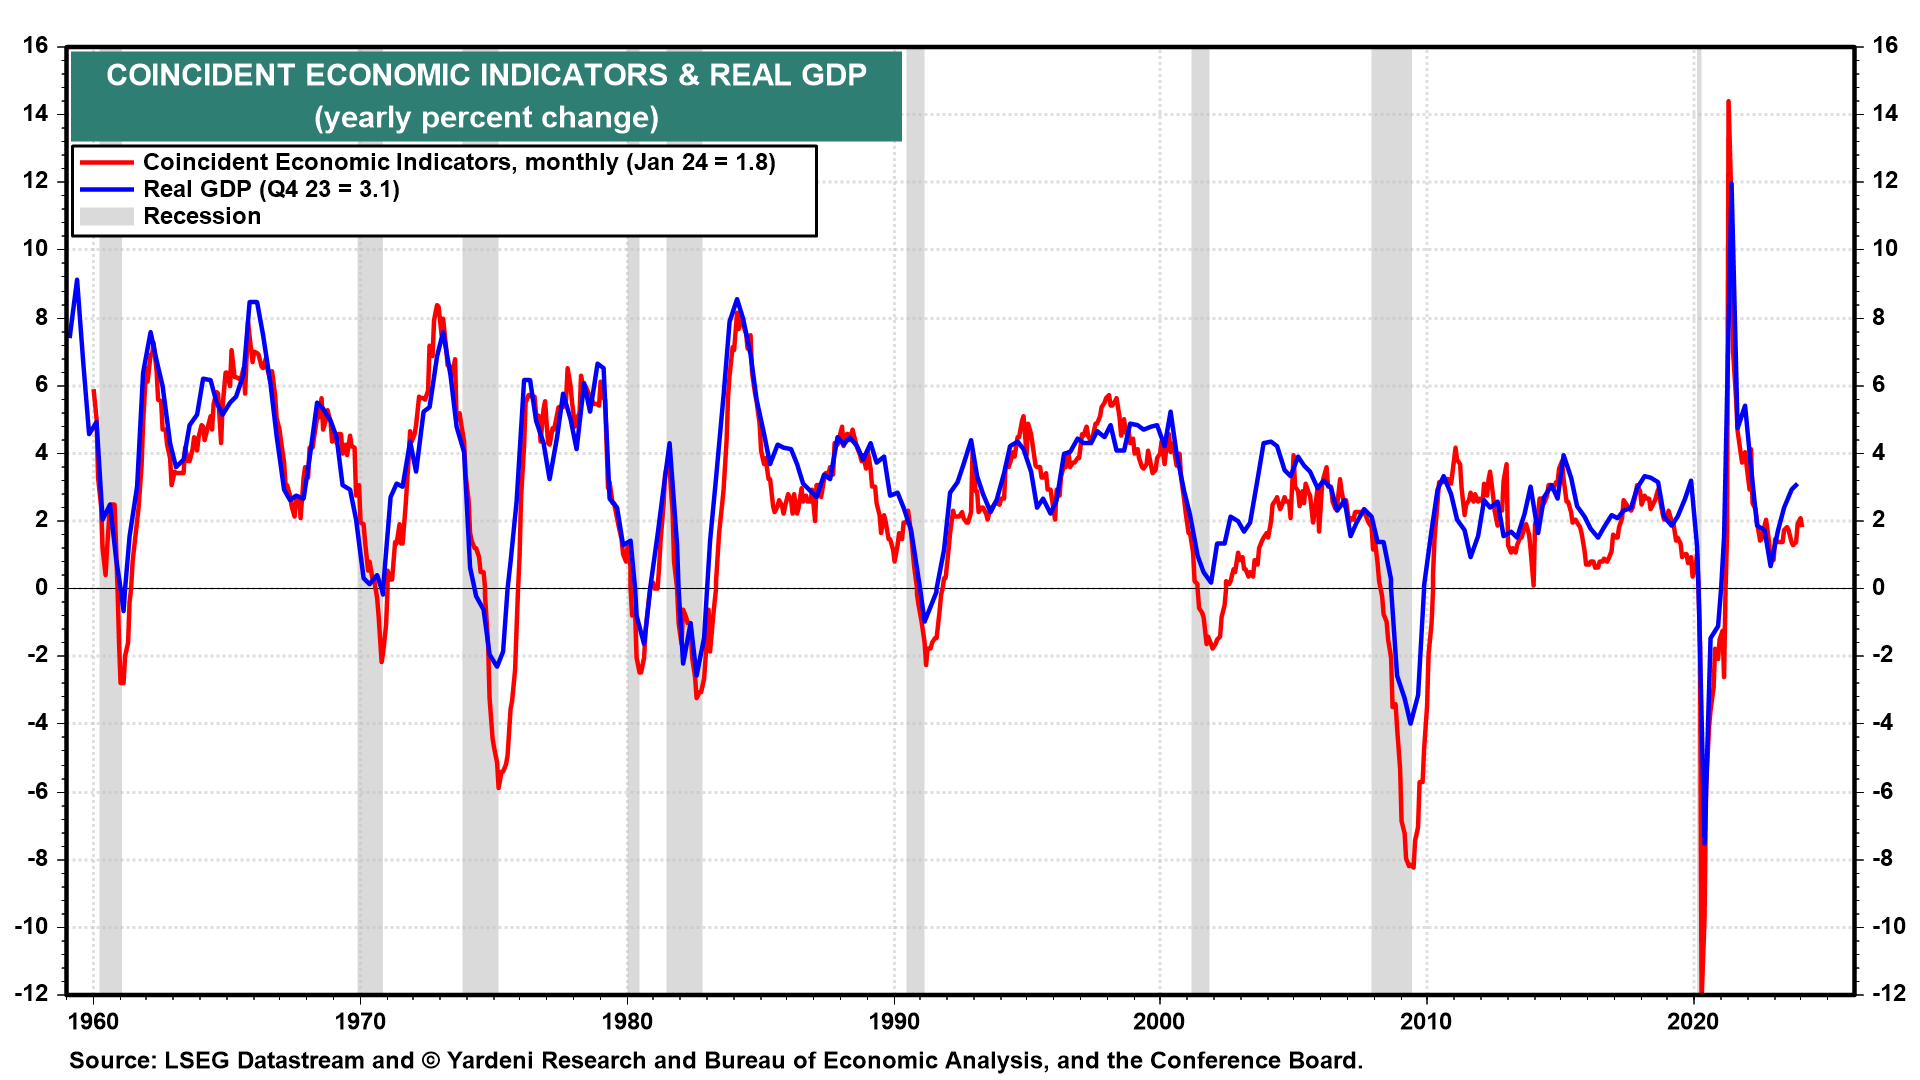
The CEI is highly correlated with real GDP, with both on a y/y basis (chart). The former was up 1.8% in January, confirming that real GDP is still growing. In the debate between the LEI's hard-landers and the CEI's soft-landers, the latter may have just won the debate.


