


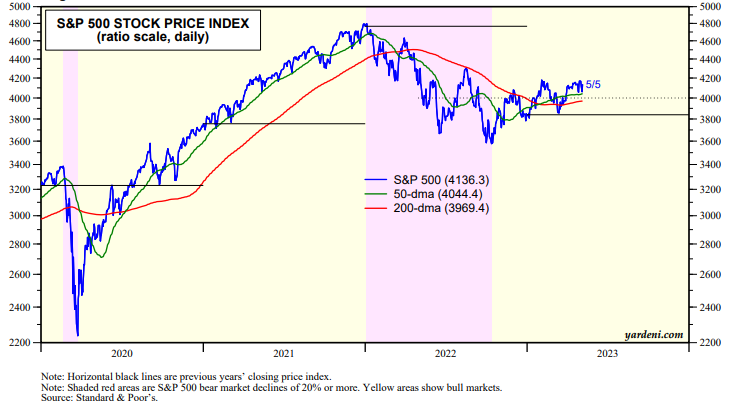
The bulls and the bears continue their tug of war with the S&P 500 fluctuating around 4000 since last summer (chart). The index rebounded off its 50-dma on Friday. The 200-dma has been crawling higher since the start of this year.
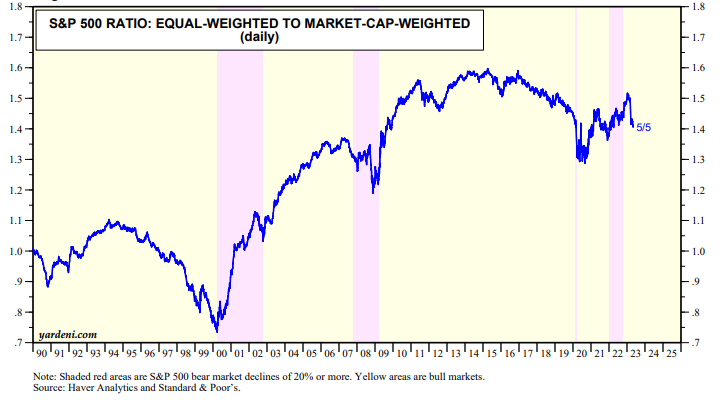
In mid-March, when the banking crisis started, the breadth of the market narrowed as evidenced by the drop in the ratio of the S&P 500 equal-weighted to market-cap-weighted indexes (chart).
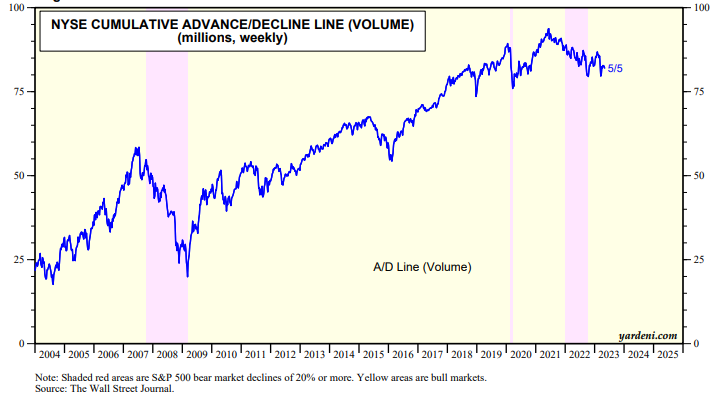
The NYSE cumulative Advance/Decline Line has also remained weak since the banking crisis hit (chart).
Here is Joe Feshbach's latest thoughts on the market from a trading perspective: