Some of our best friends are technicians. Ed was at Prudential Equity Group at the same time as Ralph Acampora, the renowned market historian and technical analyst. Ralph's analysis often confirmed Ed's fundamental analysis. So in our spare time we like to follow the charts for clues about the future, and we occasionally spot trends that seem to support our forecasts.
Currently, we are focusing on the bond, oil, gold, and Nasdaq charts, which look bearish, bearish, bullish, and bullish respectively:
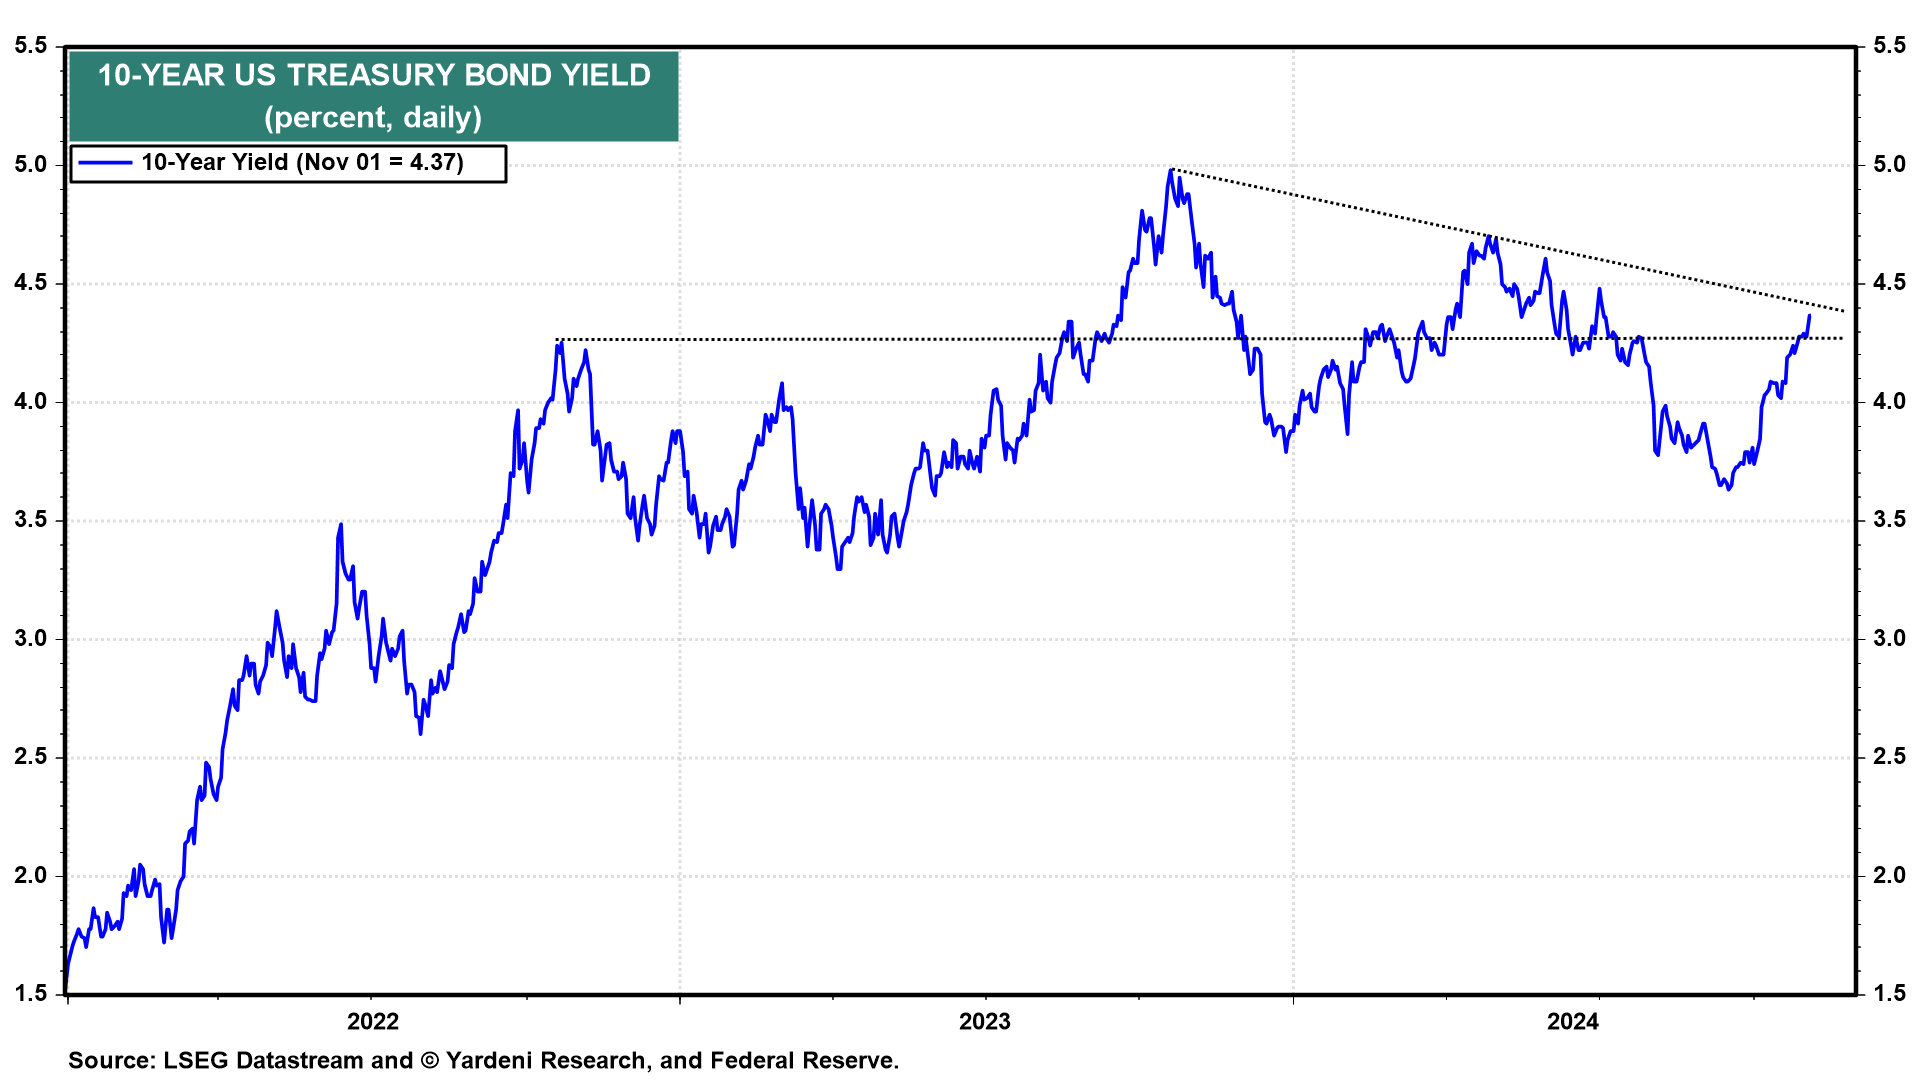
(1) Bonds. Our August 19 Morning Briefing and webcast were both titled "Get Ready To Short Bonds?" The 10-year bond yield was 3.86% at the time (chart). It fell to 3.63% on September 16. Since then it has jumped to 4.397% this evening. It broke right through a resistance line at 4.26%. If it breaks through 4.40%, the next stop could by 4.70%, which was the April 25 peak. If that doesn't hold, then a test of the 5.00% level is possible. That was last year's peak on October 19.

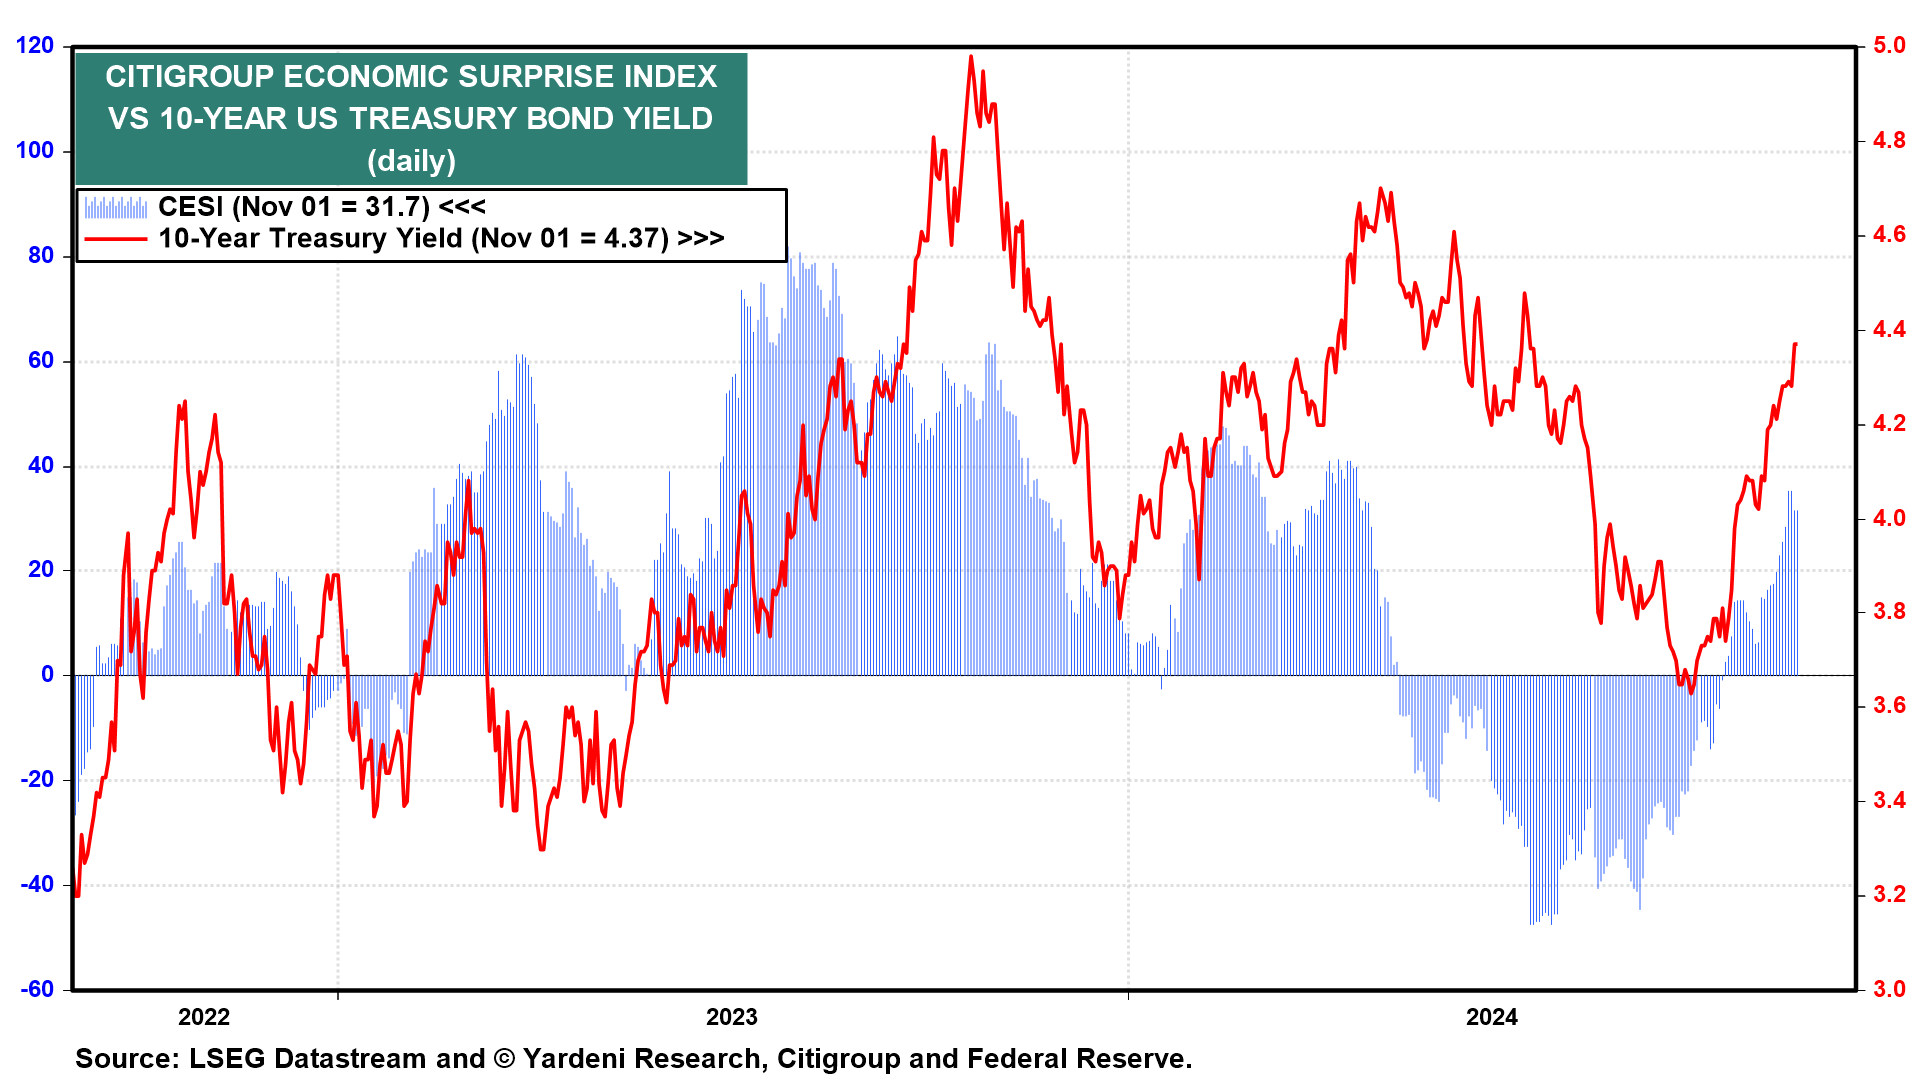
The bond yield has been rising on better-than-expected economic numbers, as we anticipated (chart). We actually turned more bearish on bonds after the Fed cut the federal funds rate by 50bps on September 18, figuring the Fed was stimulating an economy that didn't need to be stimulated. That's especially true since fiscal policy remains stimulative and may continue to be so with the new incoming administration. The bond market seems to agree with our assessment.

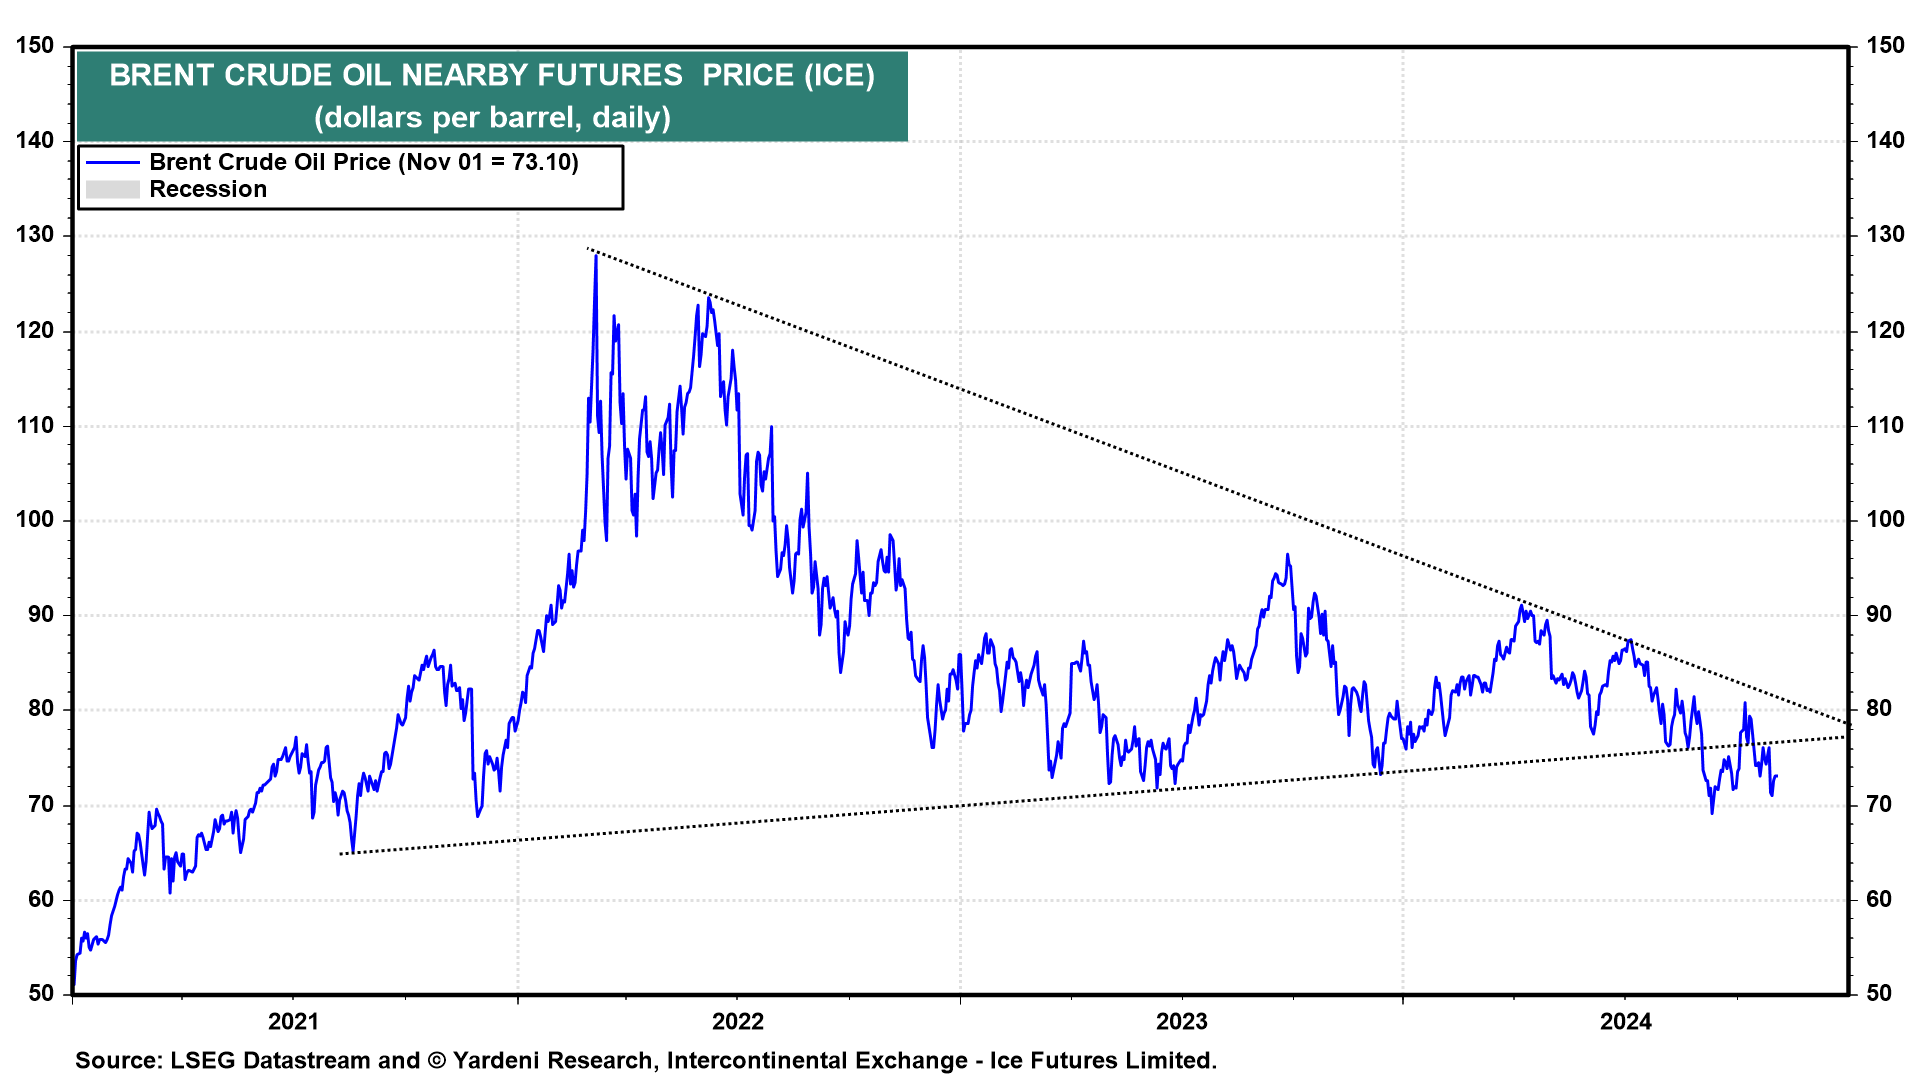
(2) Oil. Often in the past, the bond yield has had a positive correlation with the price of oil mostly because the expected inflation spread between the 10-year nominal bond yield and the comparable TIPS yield is highly correlated with the price of oil, which makes sense. In recent weeks, despite the escalating war in the Middle East, the price of oil has been weak reflecting the lackluster global economy (chart). Yet the bond yield has risen sharply along with the expected inflation spread. Investors are worrying that the Fed is easing too much too soon, thus raising the risk of reviving inflation.

(3) Gold. Gold is a hedge against inflation, domestic political instability, and geopolitical crises. Gold was trading around $1900 per ounce when Russia invaded Ukraine in February 2022. The US and its allies slapped sanctions on Russia, including freezing the country's currency reserves. Since then, the central banks of America's geopolitical adversaries have been buying more gold. So now the gold price is breaking out above an ascending trendline that started in 1980 (chart)

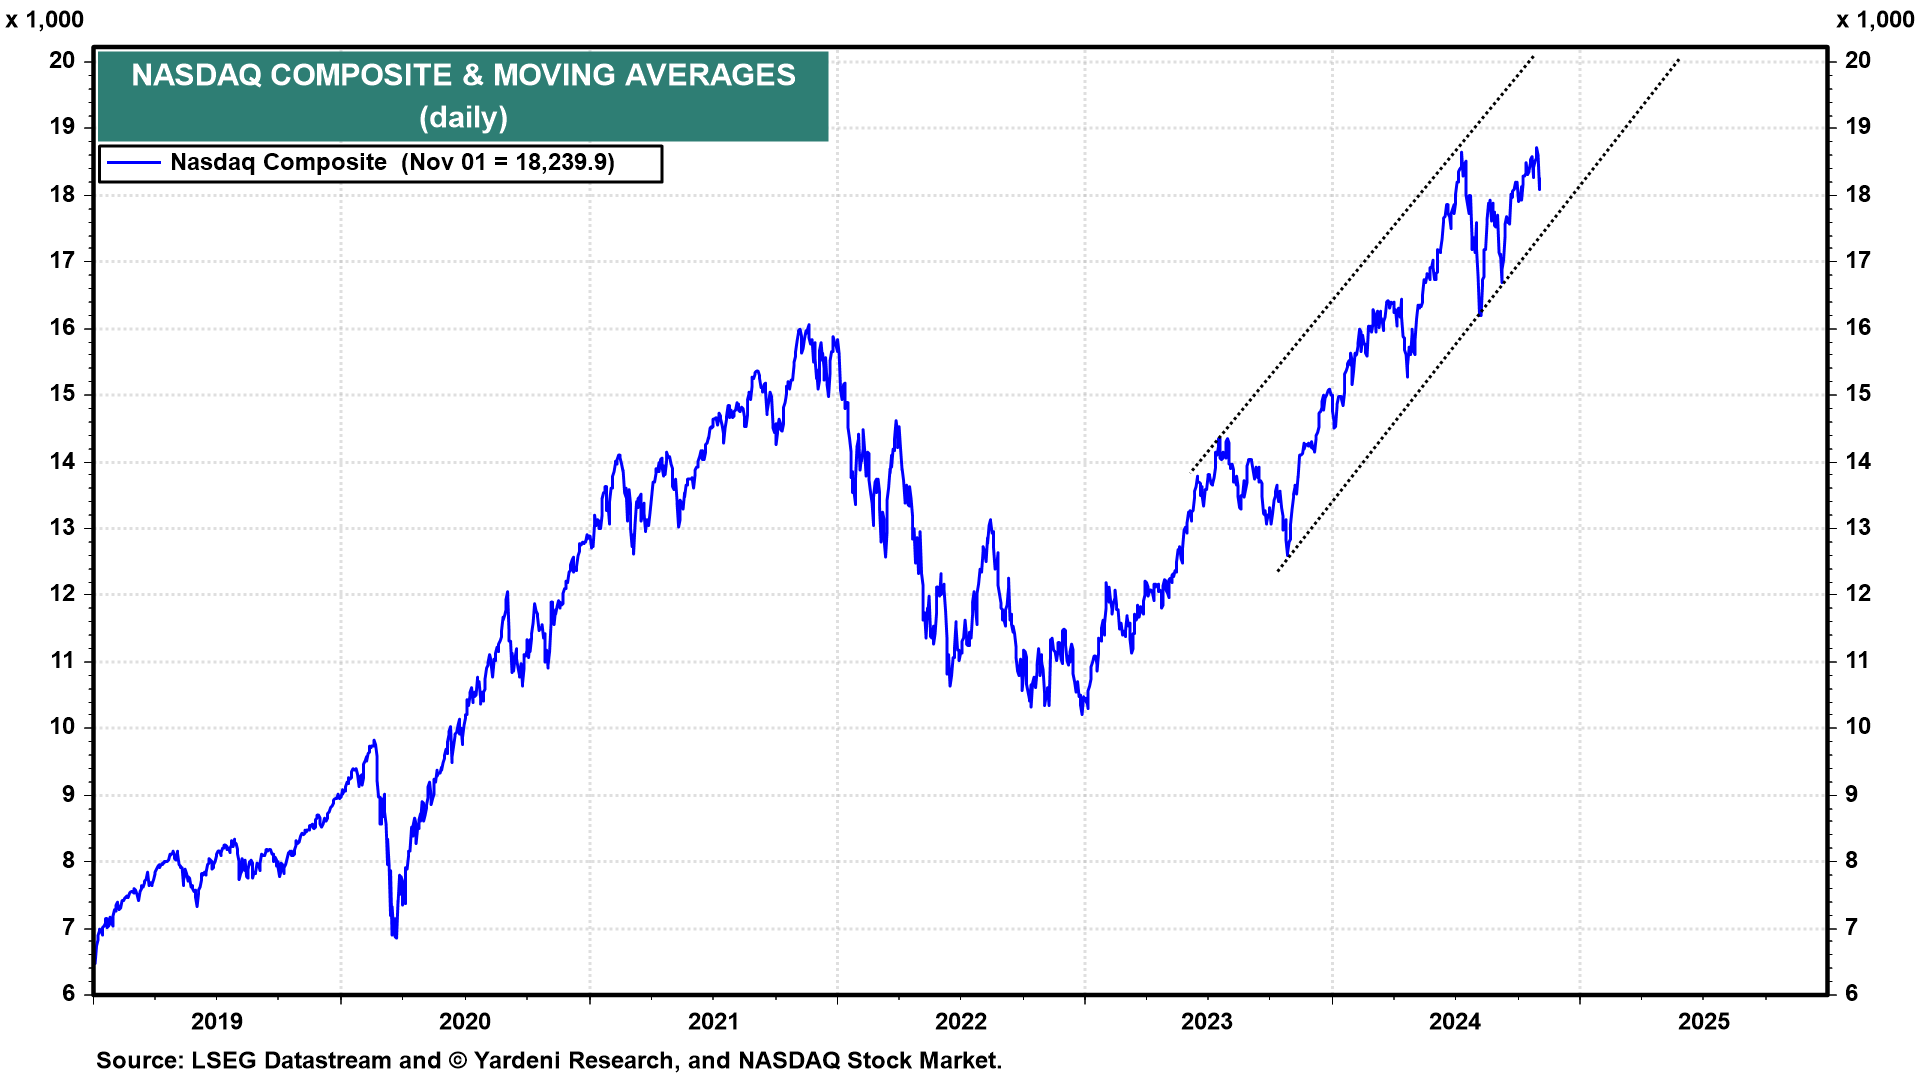
(4) Nasdaq. The Nasdaq composite has been volatile, but trending higher in a channel that started in late 2023 (chart). If it stays in that channel, it should hit 20,000 before May 2025. That's likely to happen in our Roaring 2020s scenario. A backup in the bond yield to 5.00% would undoubtedly depress the Nasdaq and delay such a move by the Nasdaq.

We asked Michael Brush for an update on insider activity: "Beneficial owners (10%+ holders) were big buyers last week in energy and biotech, and Berkshire Hathaway continued to load up one of its favorite entertainment stocks. While actual insiders (directors and executives) remained scarce, they did make several actionable buys in retail. Insiders appear bullish on the consumer." Thanks, Michael!


