There have been numerous misleading economic indicators signaling a recession since the Fed started tightening monetary policy in early 2022. Among the worst have been the inverting yield curve and then the disinverting yield curve. And, of course, there's the falling Index of Leading Economic Indicators (LEI), which is long overdue for a product recall.
On the other hand, S&P 500 operating forward earnings has been a remarkably useful guide that kept us from falling into the recession trap. This series is the time-weighted average of industry analysts' consensus expected S&P 500 operating earnings per share during the current year and coming year. Consider the following:
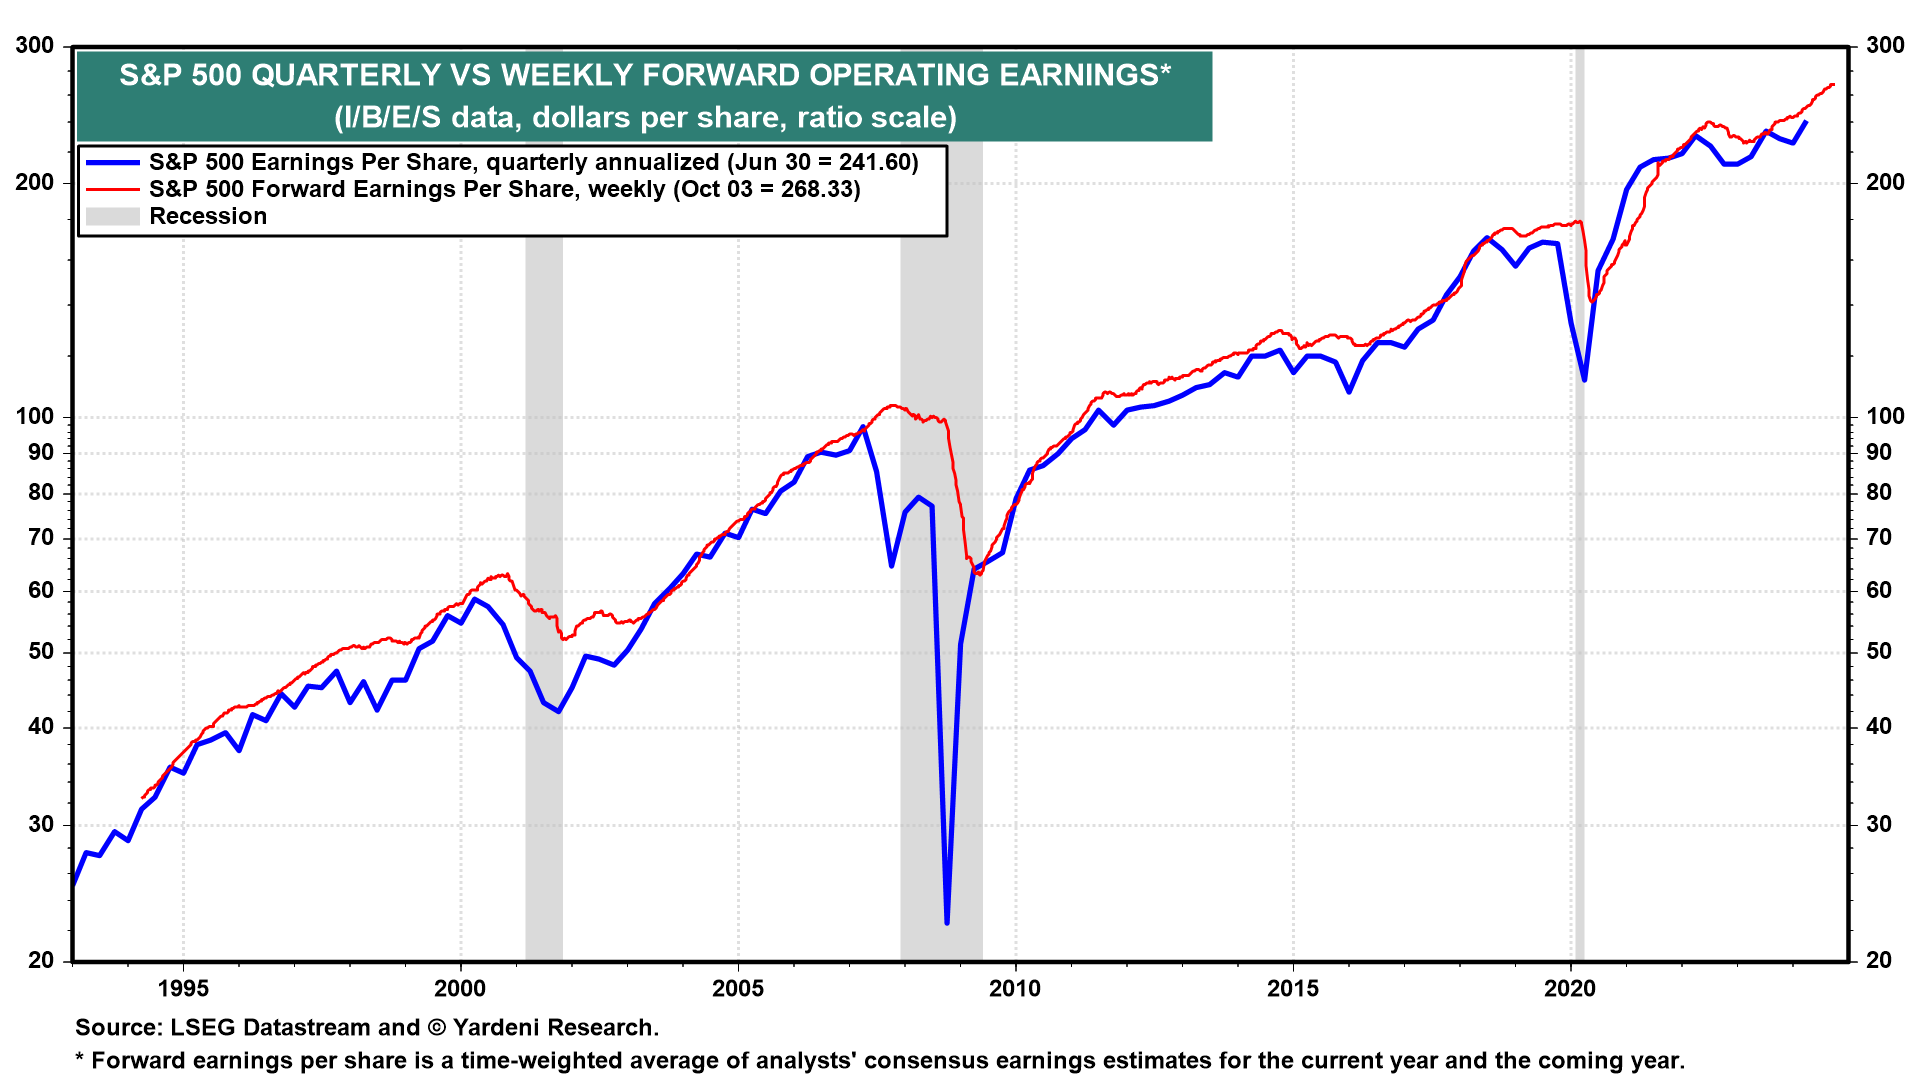
(1) Weekly forward earnings. S&P 500 operating forward earnings per share (EPS) is available weekly since April 1994 and monthly since September 1978. It closely tracks actual quarterly S&P 500 operating EPS (chart). We've often observed that it doesn't anticipate recessions (which is our job to forecast), but it is a very good coincident indicator of actual EPS when the economy is expanding. We consider it to be a leading indicator because it is available weekly.
Forward earnings rose to a record high during the October 3 week. It dipped during H2-2022, bottomed in early 2023, and has been rising to new record highs since late 2023 (chart). So it has mostly been confirming our no-landing scenario.

(2) Monthly forward earnings. The monthly series for S&P 500 operating EPS closely tracks the Index of Coincident Economic Indicators (CEI) (chart). The former rose to a new record high in September, while the latter did the same in August. The LEI has been a very misleading indicator indeed.


