

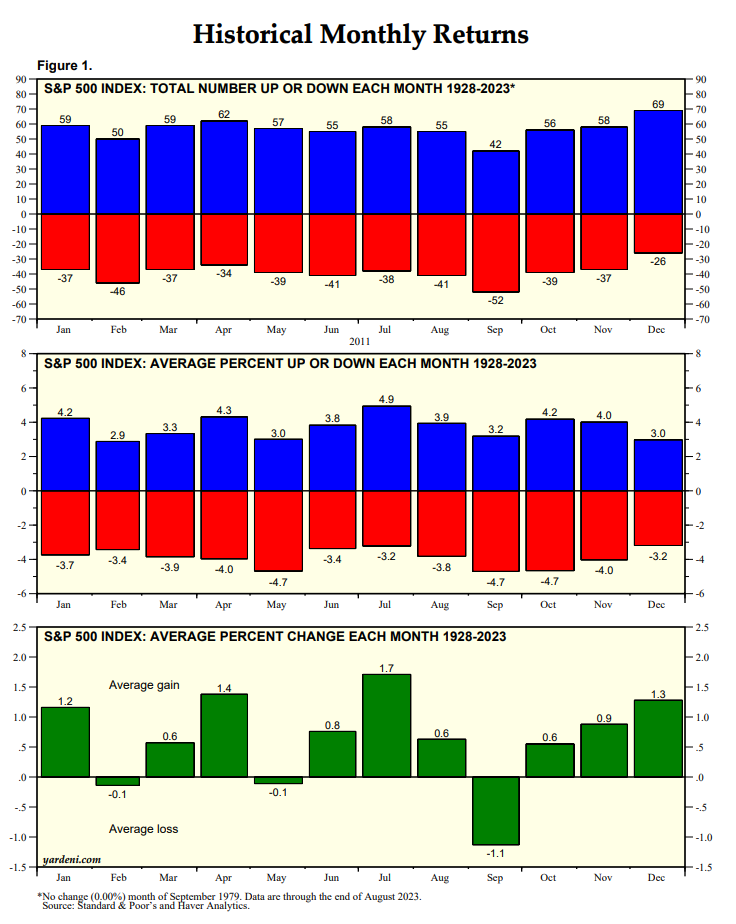
September is the Rodney Dangerfield of the 12 months; it gets no respect because it has been the worst month for stocks on average since 1928 (chart). However, it has been up 45% of the time since then with a solid average gain of 3.2%. Even if the market is down this month, September is a good month for picking apples and it could be a good month for picking stocks.
The market's performance this month will probably depend on August's CPI report, which will be released Wednesday, September 13. That will probably determine whether the 10-year Treasury bond yield continues to trade below 4.25% and whether the FOMC decides to hike or not on September 20.
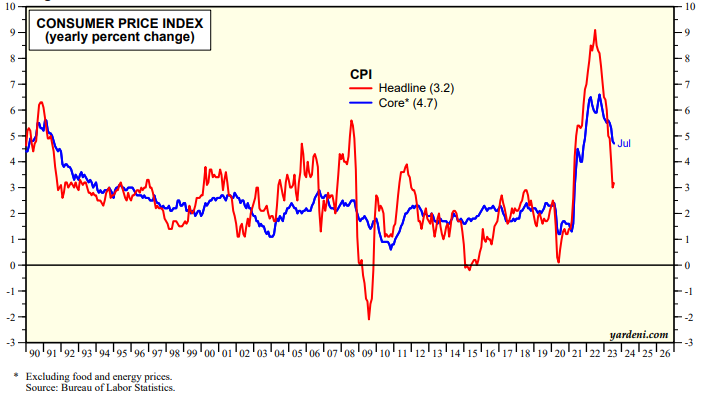
The headline CPI inflation rate was 3.2% in July. Truflation is tracking that rate at around 2.60% in August, down from July's 2.73% tracking. On the other hand, the Cleveland Fed's Inflation Nowcasting is tracking August's headline and core CPI inflation rates at 3.8% and 4.5% versus 3.2% and 4.7% for July's actuals (chart).
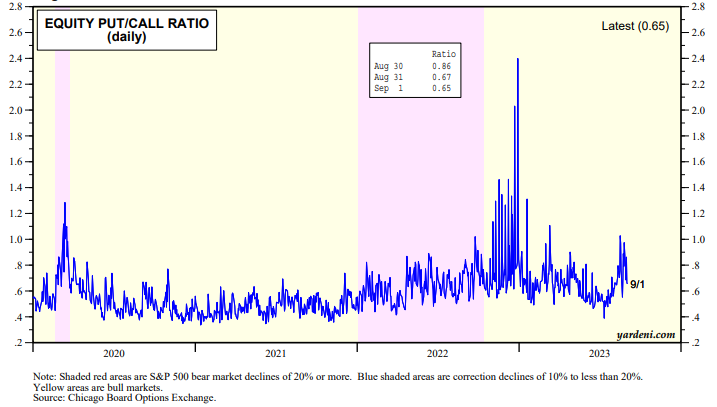
The S&P 500's solid gain of 2.5% last week was predicted by the recent elevated put/call ratios around 1.00 (chart). The index was back above its 50-day moving average by 1.0% and the ratio was back down to 0.65 on Friday.
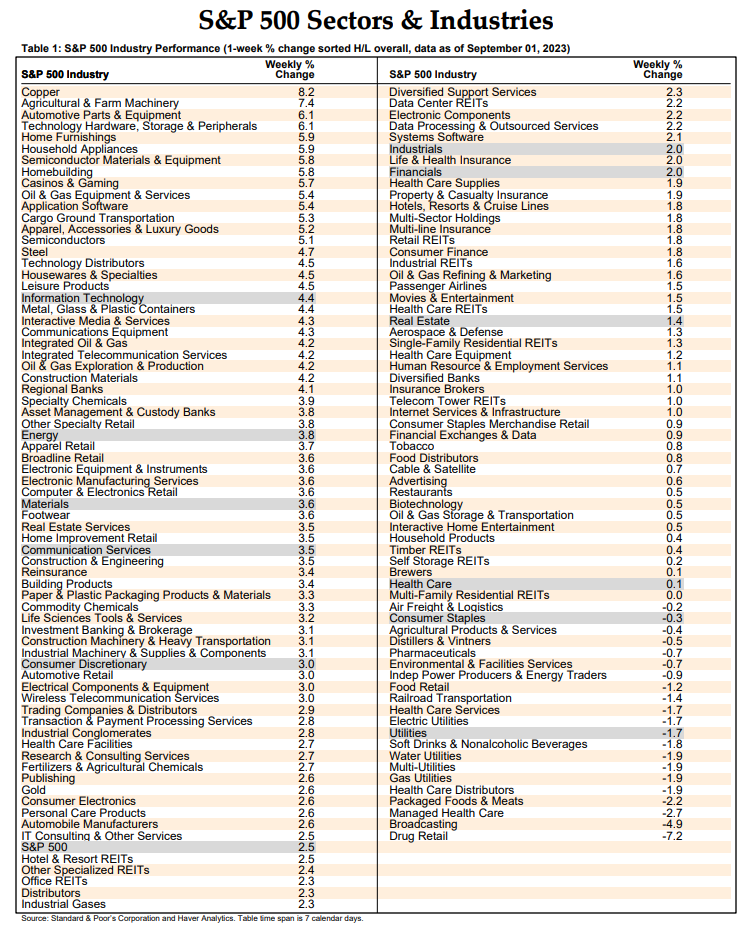
Finally, below is last week's performance derby for the S&P 500 and its 11 sectors and 100+ industries. It is interesting to see Copper as #1. We are skeptical that China's economy is about to rebound as a result of the government's stimulus efforts. But Professor Copper seems to think otherwise.