

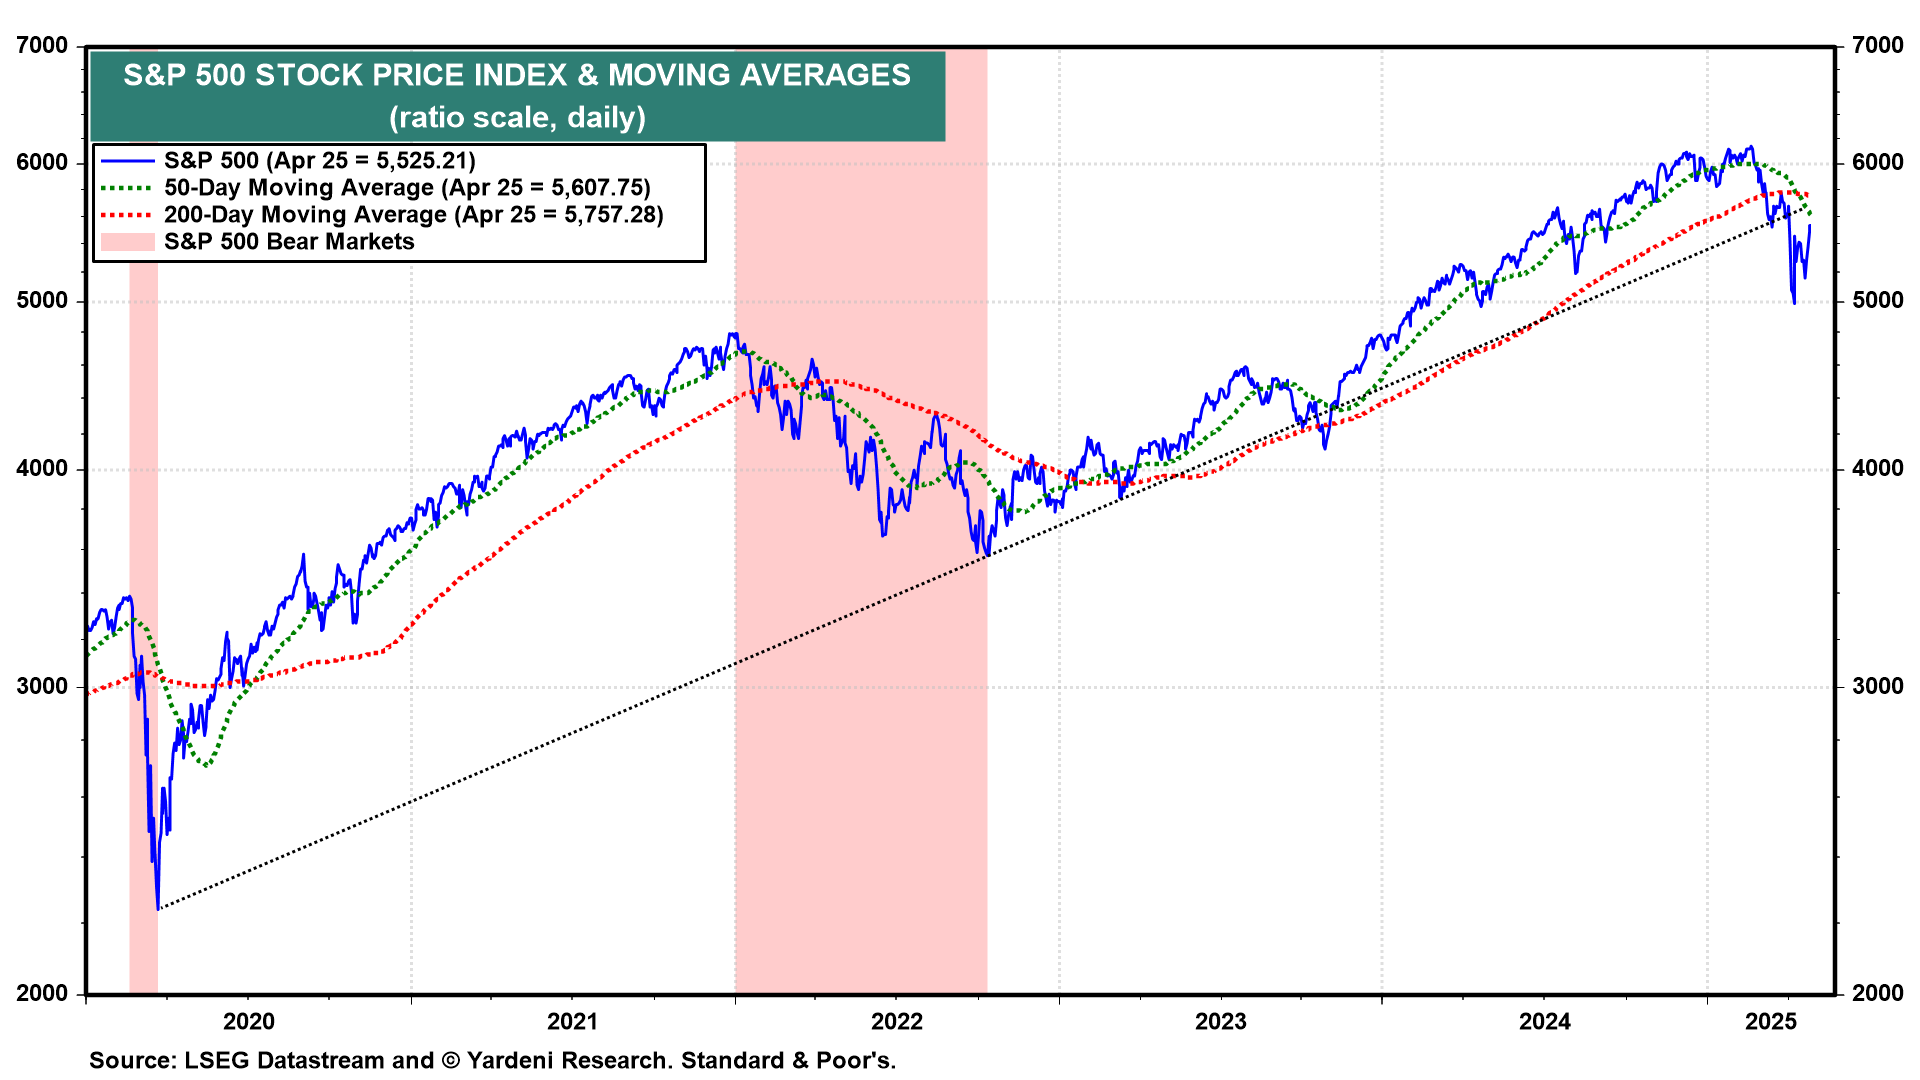
Only a few days ago, some stock-market-chart watchers warned that Trump's Tariff Turmoil (TTT) set up a bearish Death Cross formation in the S&P 500 and Nasdaq 100. That occurs when the 50-day moving average crosses below the 200-day moving average (chart). The formation historically has signaled declines ahead, but not all Death Crosses have preceded major downturns.
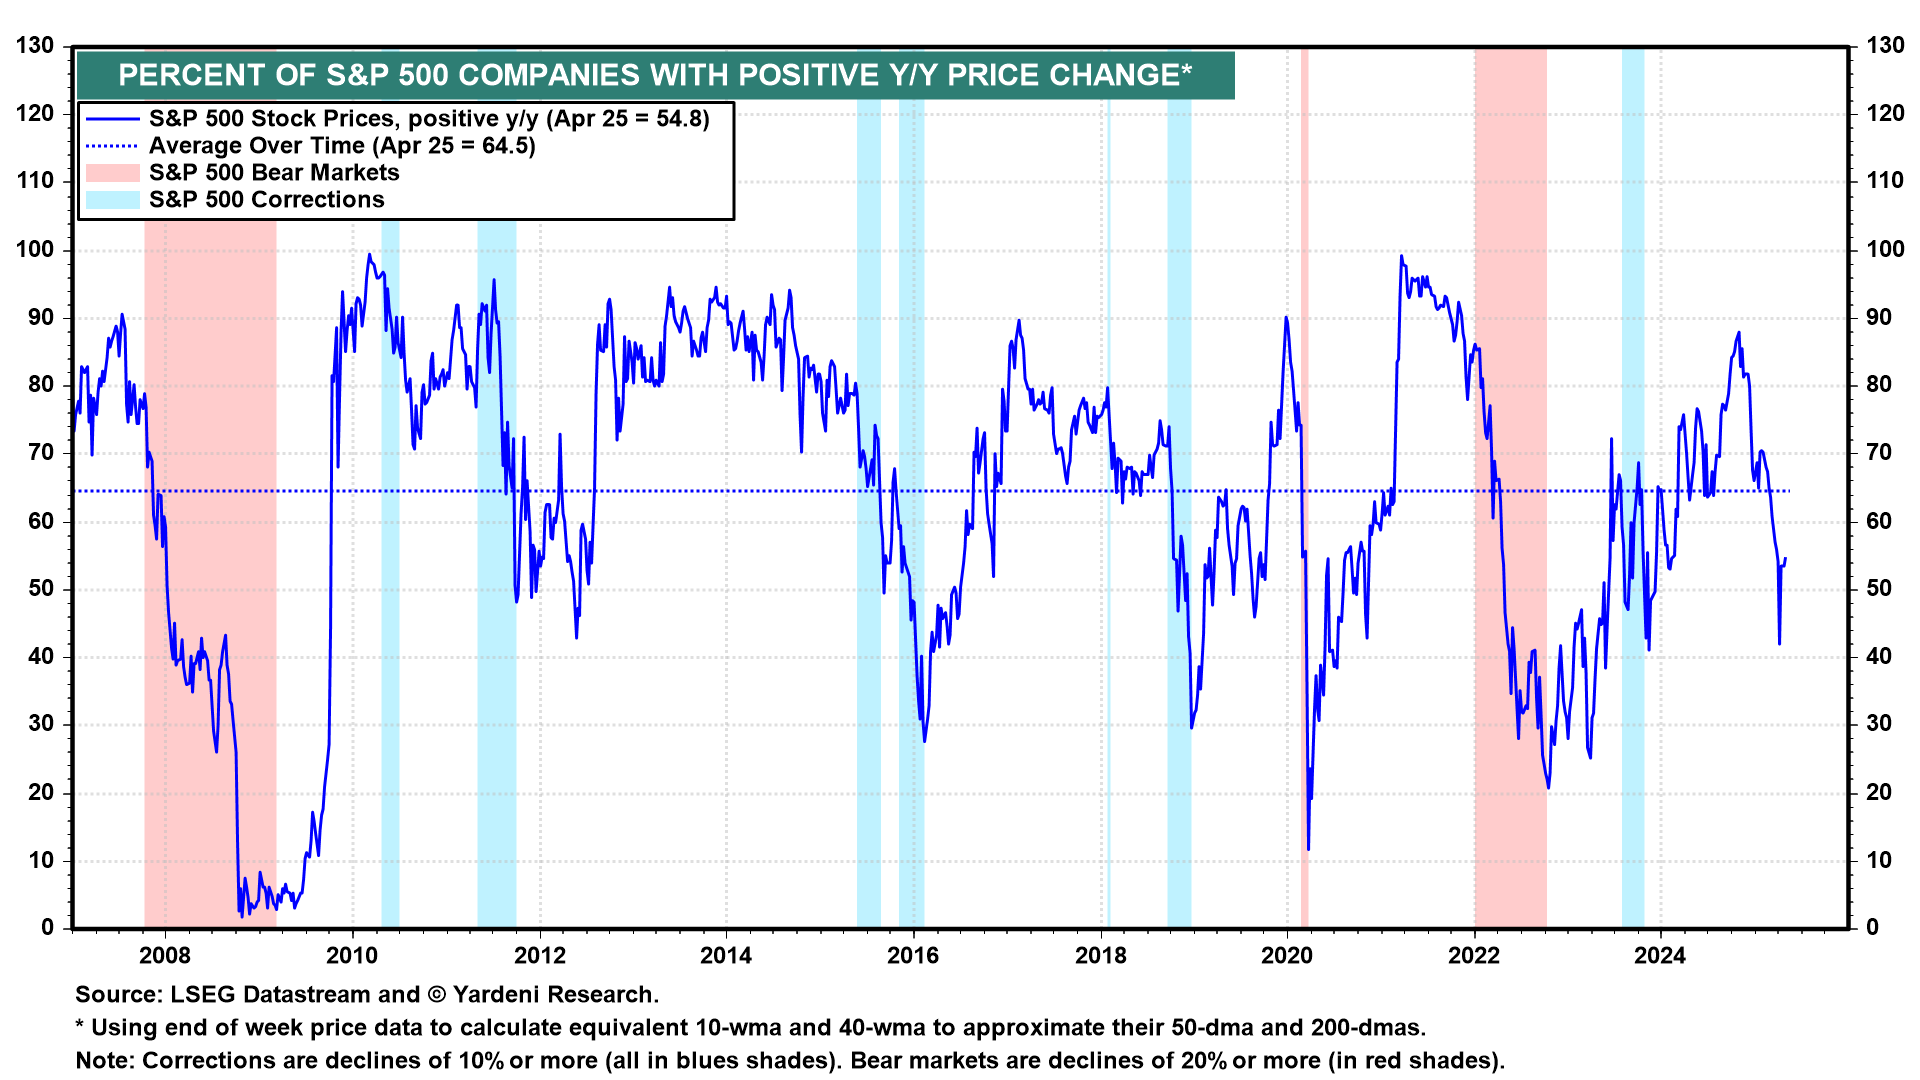
Now some market watchers are seeing a bullish Zweig Breadth Thrust, a technical analysis tool developed by Martin Zweig. It measures market breadth by analyzing the percentage of advancing stocks relative to the total number of stocks (advancing and declining) over a 10-day period. A "thrust" occurs when this indicator rises rapidly from below 40% to above 61.5% within 10 days, suggesting a potential market rally. A similar version of this concept is the percent of S&P 500 companies with positive y/y percent changes (chart). It's shown lots of thrust since April 8, i.e., the day before Liberation Day was postponed for 90 days by President Donald Trump.
Since late last year, we've been expecting a "choppy" correction during the first half of this year as investors assessed the outlook for Trump 2.0. That's what we are seeing in the charts. Admittedly, the market has been choppier in response to TTT than we expected, and we chopped our year-end target for the S&P 500 from 7000 to 6000 back in March. Now our year-end targets are 7000 in 2026, 8000 in 2027, 9000 in 2028, and (still) 10,000 in 2029.
Let's review some of the fun facts about the current correction in the S&P 500:
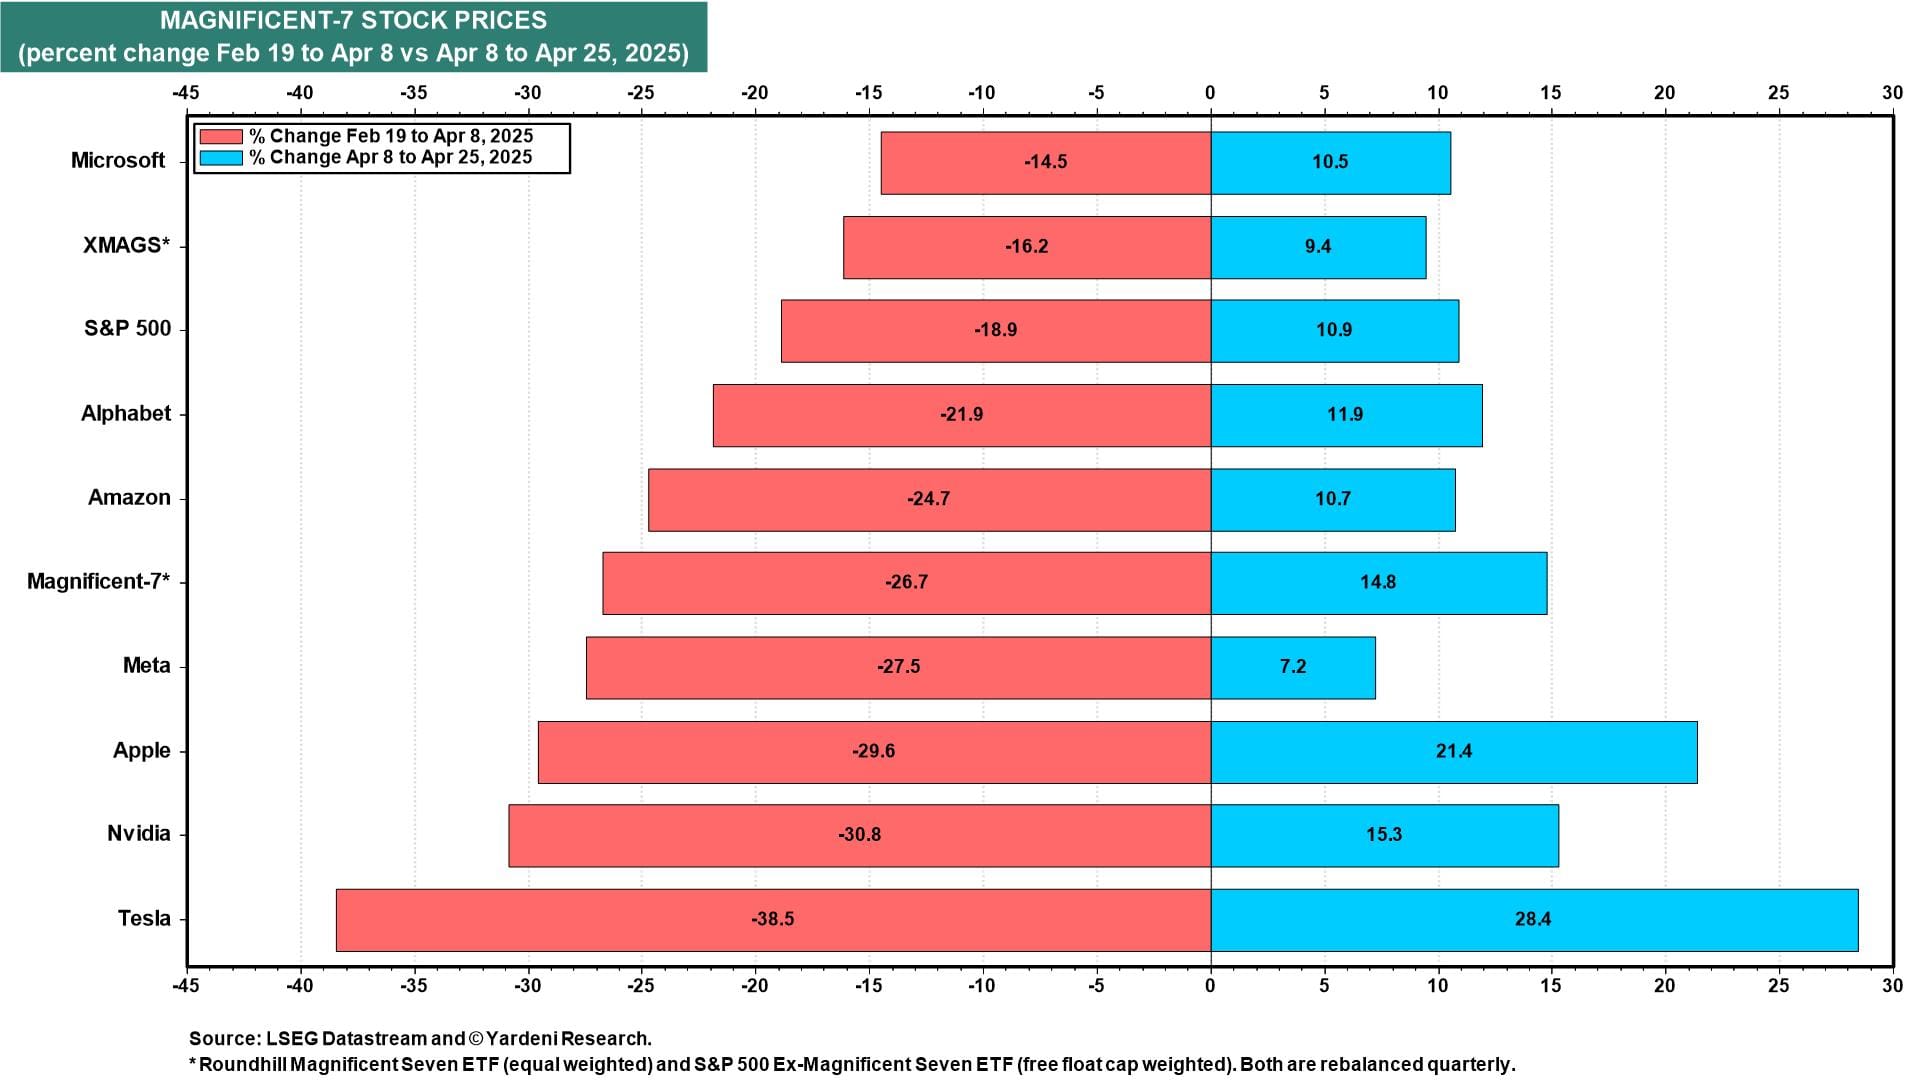
(1) From February 19 through April 8, the S&P 500 fell 18.9% (chart). It has rallied 10.9% since then. It is now down only 10.1% from its record high on February 19. That's not too bad under the circumstances.
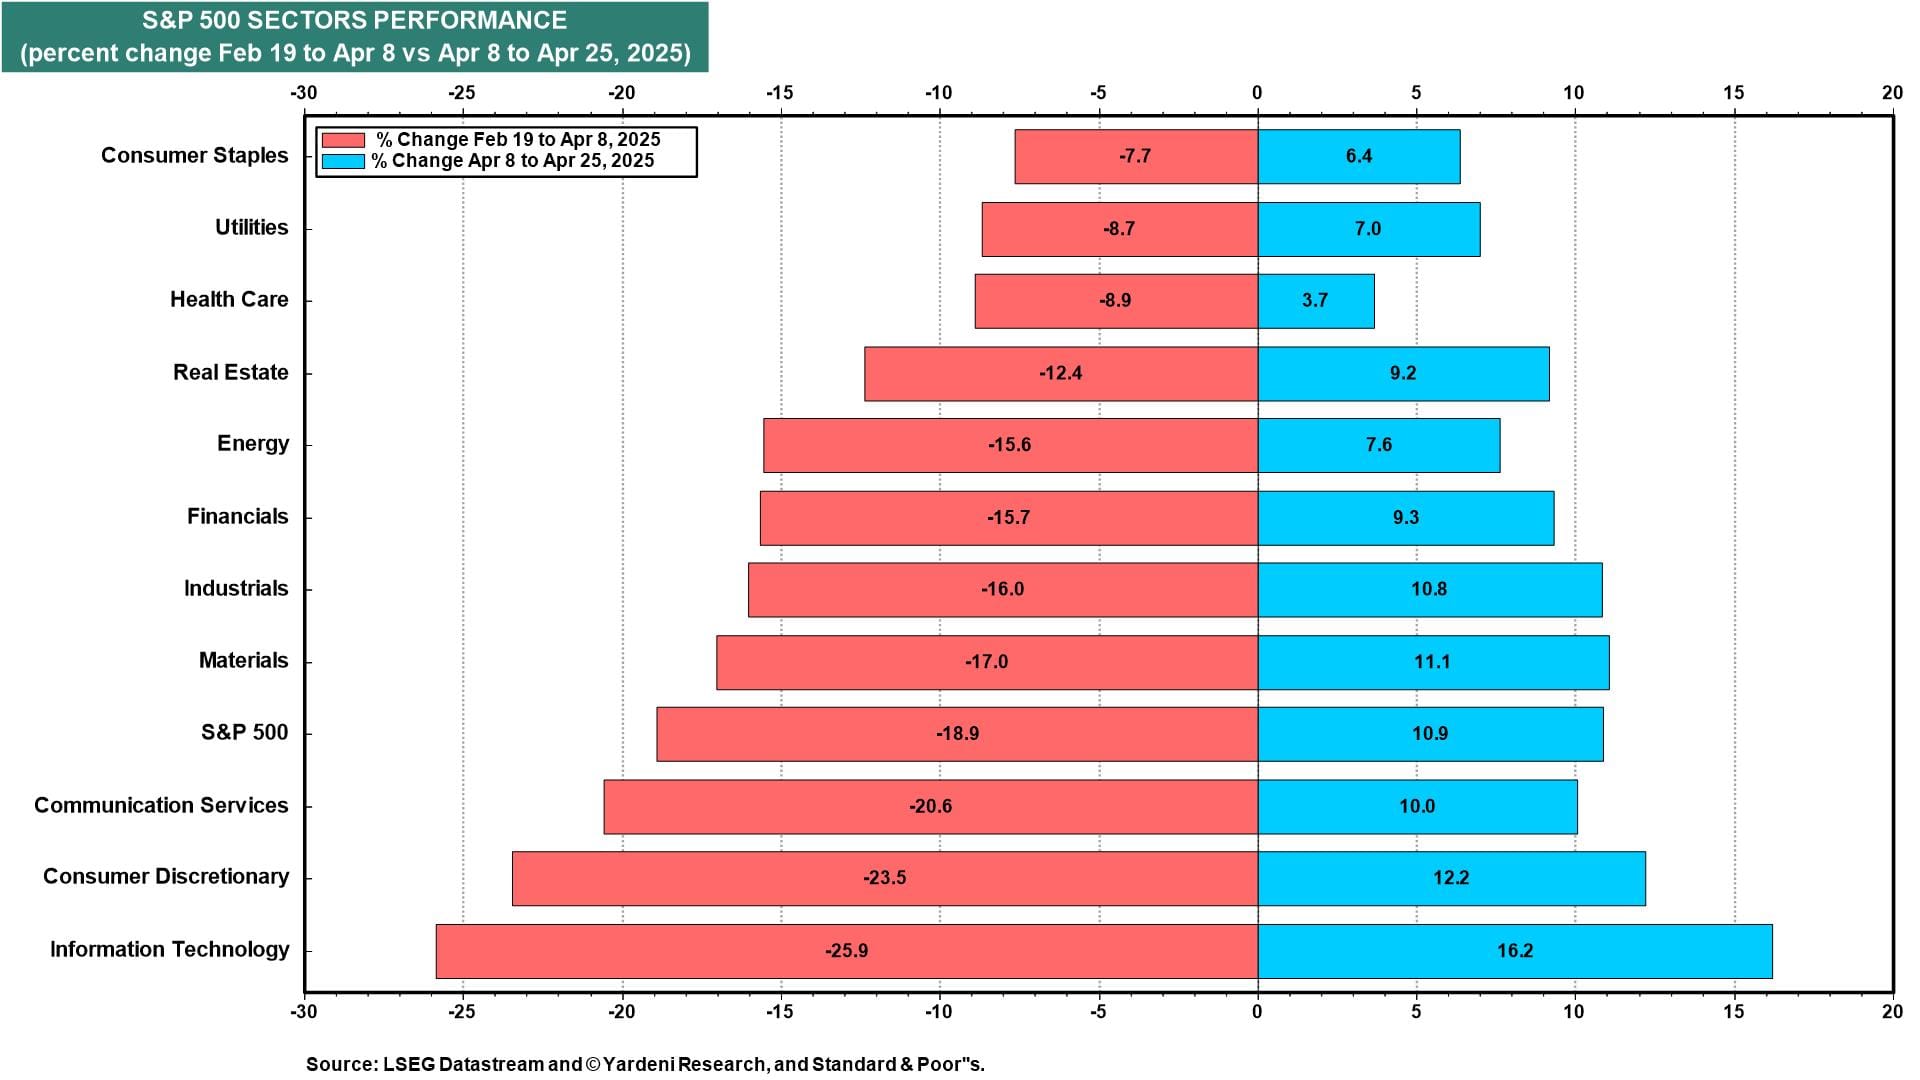
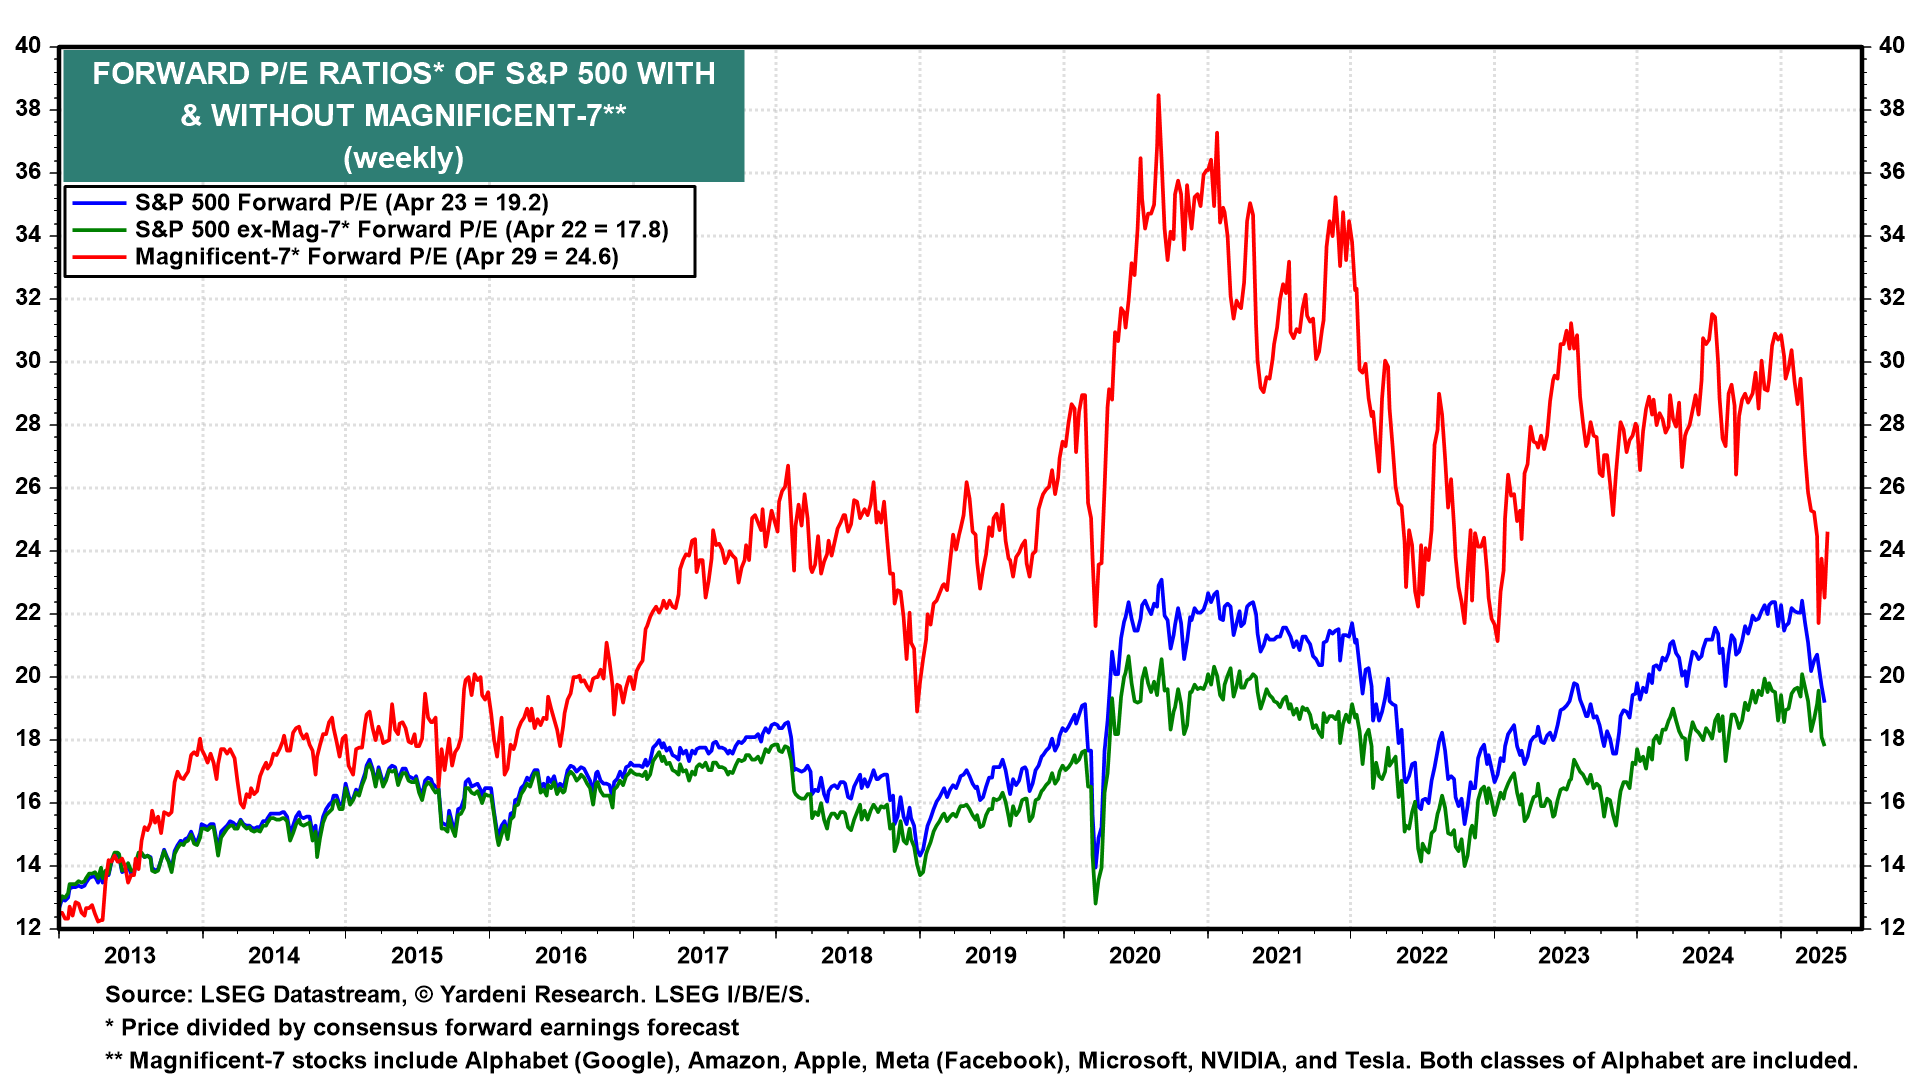
(2) The Magnificent-7 led the way down in the correction (chart). Now they are leading the way up again. Concerns about AI capital spending have dissipated, as it remains robust because demand for cloud computing is growing along with AI usage.
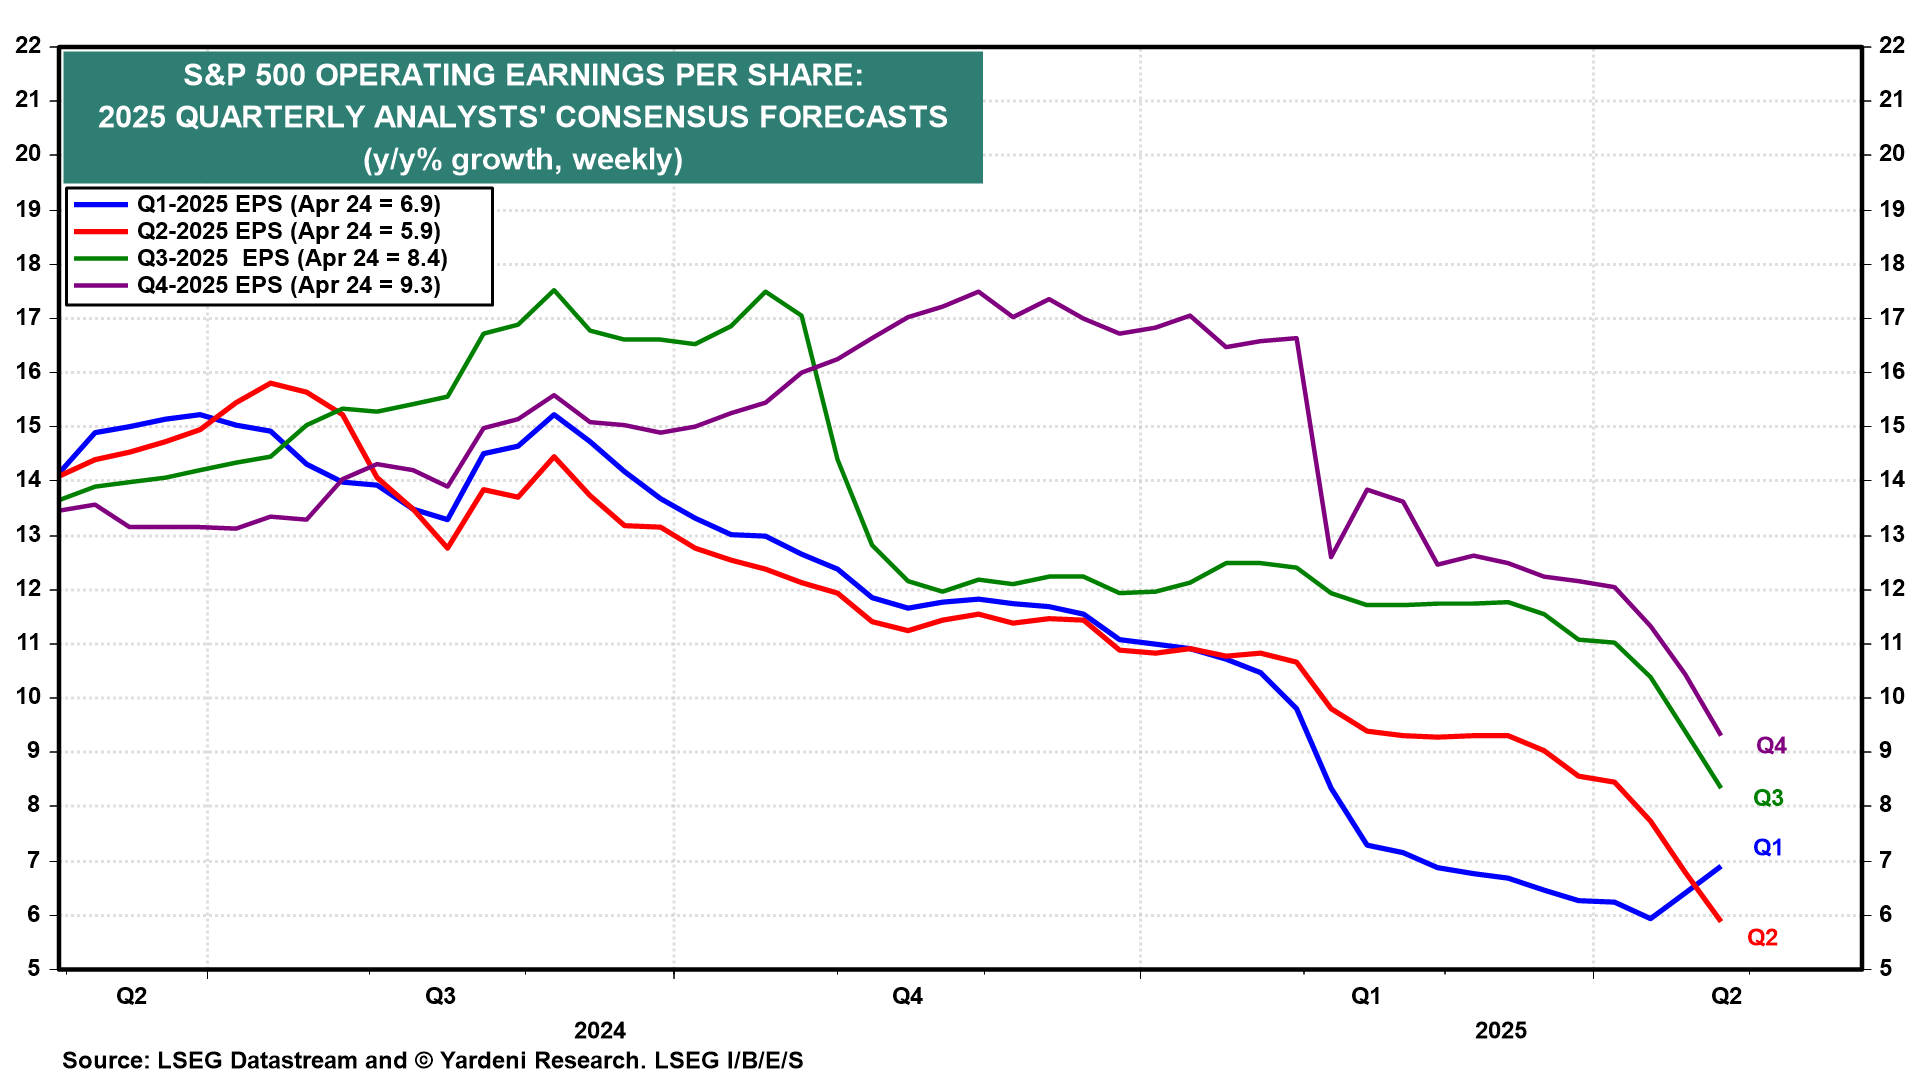
(3) Industry analysts are scrambling to lower their S&P 500 earnings growth forecasts for the remaining three quarters of this year (chart). They are anticipating that if the tariff war between the US and China doesn't end soon, the result might be a recession during the second half of this year. Stock investors may be looking beyond that to a better outlook for 2026.
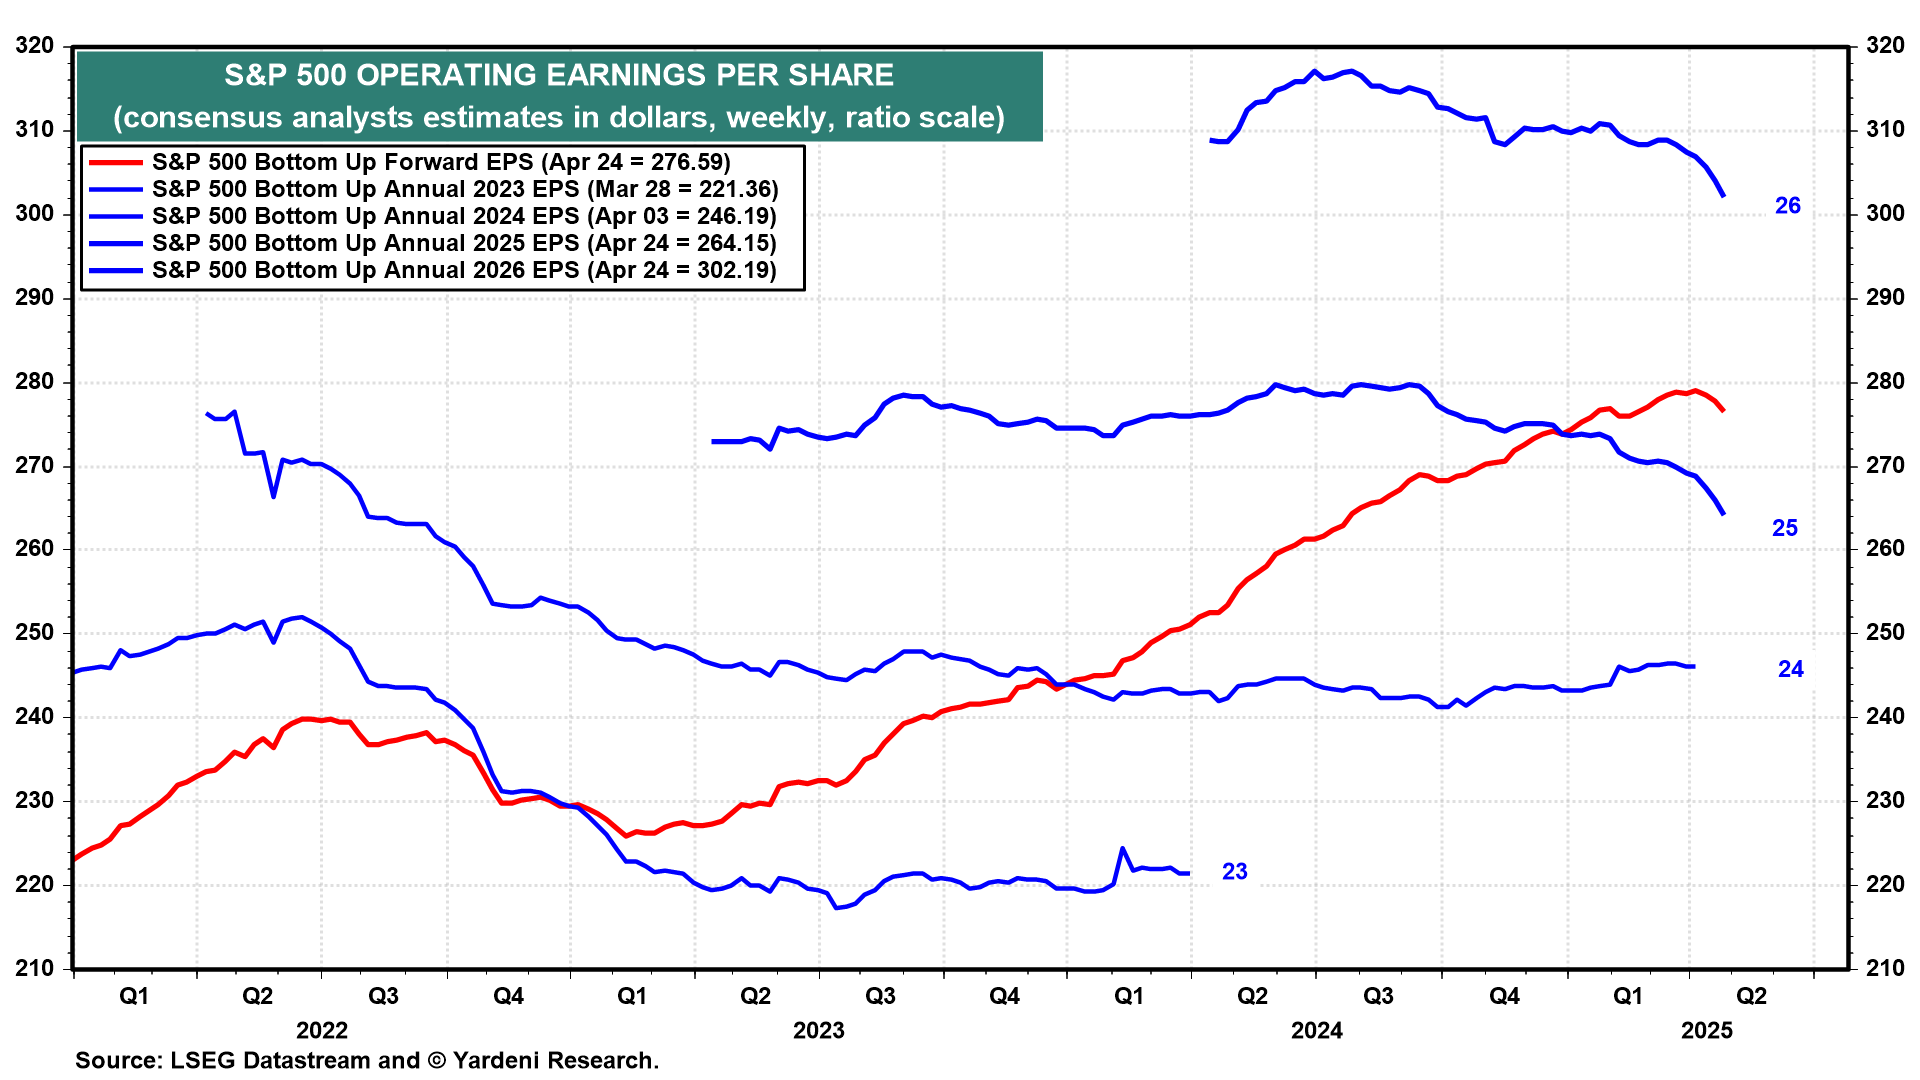
(4) Industry analysts are reducing their expectations for S&P 500 earnings this year and next year (chart). Forward earnings peaked at a record high in late March. It has declined since then through the April 24 week. So the recent rebound in stock prices is all attributable to a rising forward P/E, as investors may be starting to discount a resumption of our Roaring 2020s scenario—hinging on a tech-led boom in productivity growth—in 2026.
(5) The forward P/E of the Magnificent-7 plunged from 30.0 at the start of the year to 21.7 on April 8 (chart). Over that same period, the forward P/E of the S&P 500 fell from 22.4 to 19.2, while the forward P/E of XMAG declined from 18.6 to 17.8. At those valuation levels, stocks aren't cheap if a recession is coming. They are fairly valued if a soft patch later this year is followed by better growth in 2026. That's our take.