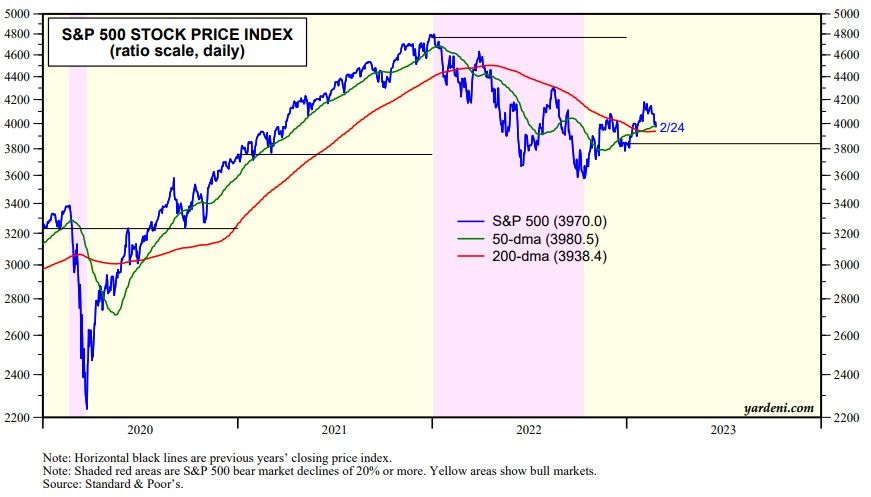
The S&P 500 was up 16.9% from last year’s low of 3577.03 on October 12, 2022 through this year’s high of 4179.76 on February 2 (chart). We still view last year’s low as the end of the bear market that started on January 3, 2022. We believe that the rally since then is the start of a new bull market, though we expect it to be U-shaped rather than V-shaped like the start of most previous bull markets. We also expect that it will be more volatile than most, at least until it’s clear that the Fed’s current monetary tightening cycle is over.

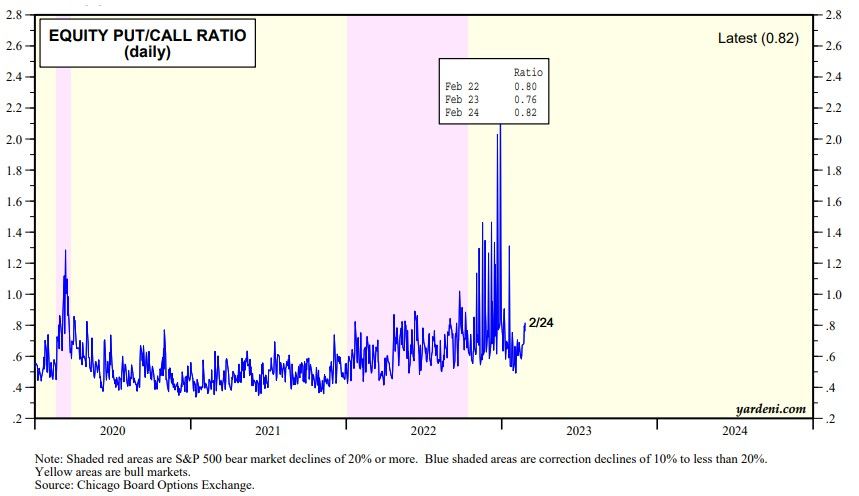
The S&P 500 is down 5.0% from its February 2 high through Friday’s close of 3970.04. It closed just below its 50-day moving average. It could easily test its 200-day moving average, which was 3938.42 on Friday. If so, it should find support at last year’s closing low of 3839.50. That would wipe out January’s impressive 6.2% gain which was fueled by visions of a soft economic landing, Fed pausing, and conversations with friendly AI versions of HAL 9000 computers. February’s selloff through Friday’s close was triggered by the release of January’s stronger-than-expected economic indicators. The equity put/call ratio rose from a recent low of 0.49 on February 2 to 0.82 on Friday (chart).

Here is Joe Feshbach’s latest market trading call:


