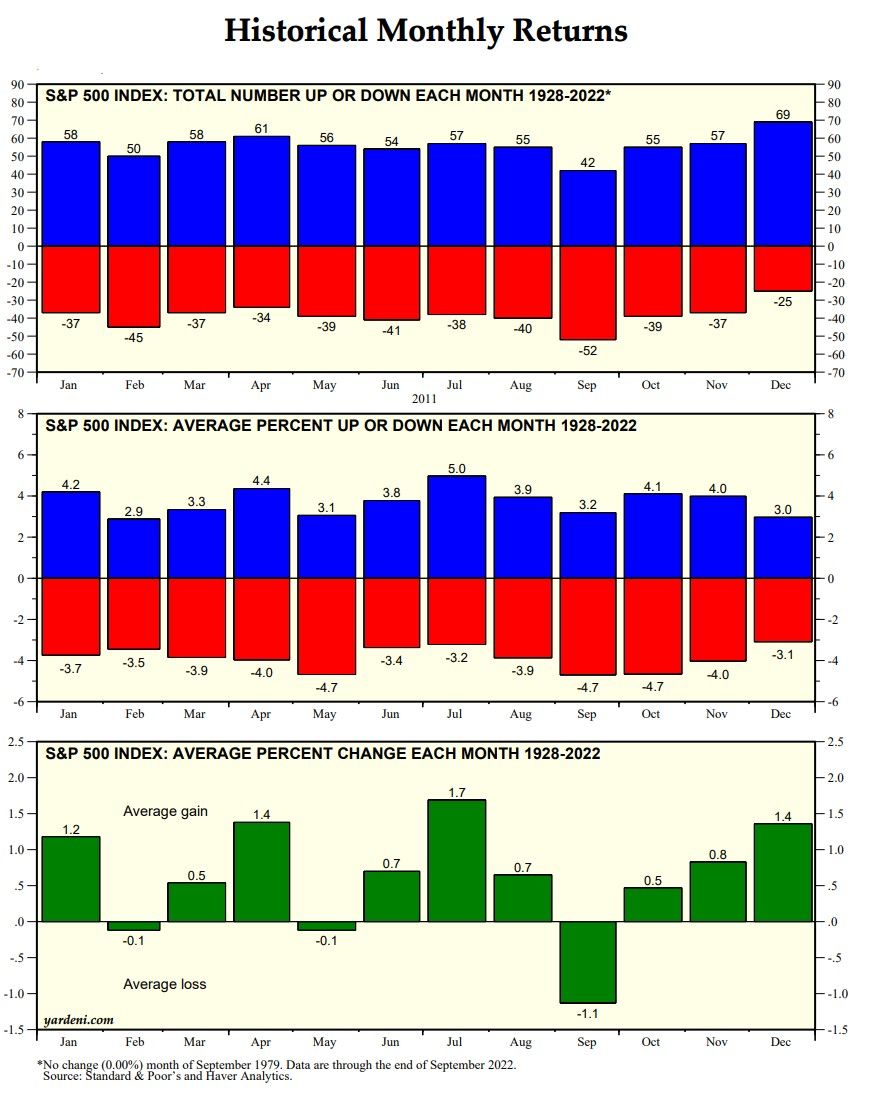
Since 1928, the S&P 500 fell 1.1% on average during September, by far the worst performance of any month. October, November, and December were up 0.5%, 0.6%, and 1.4% on average (chart). Yes, Virginia, there really is a Santa Claus rally. Apparently, it tends to be even more likely during mid-term election years.
A September 23 post on TheStreet reported, "According to the Stock Trader's Almanac … September is the worst month for stocks. … Since 1950, October has been the 7th worst month for returns. However, returns are substantially better than usual in mid-term election years, with the S&P 500 and NASDAQ returning 2.7% and 3.1% on average."
The Stock Trader's Almanac writes that October "turned the tide in 12 post-WWII bear markets: 1946, 1957, 1960, 1962, 1966, 1974, 1987, 1990, 1998, 2001, 2002, and 2011."


