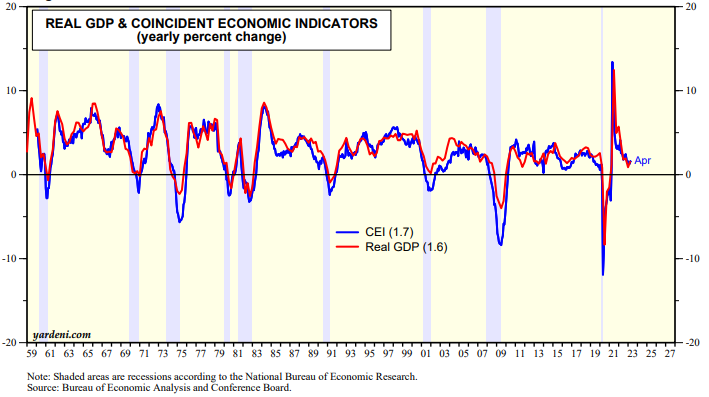
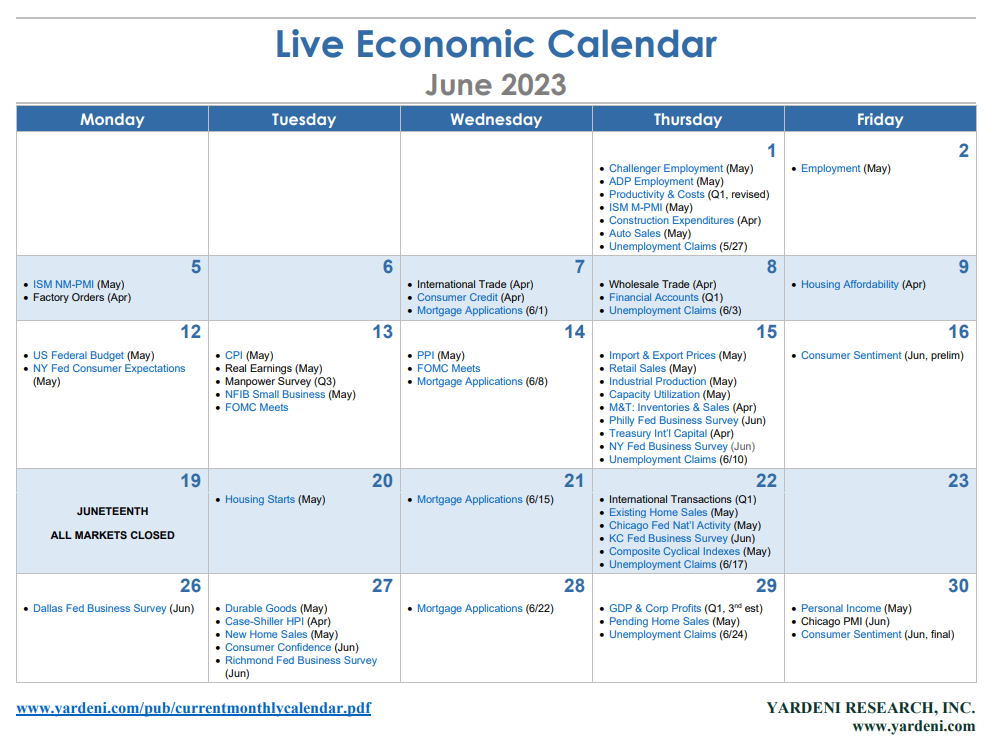
It's a short and light week for economic data. We'll be focusing on May's Composite Cyclical Indicators (Thu). The index of Coincident Economic Indicators (CEI) is the best monthly indicator of the business cycle. It tracks the y/y growth rate of real GDP very closely (chart). It was up 1.7% y/y during April, while real GDP rose 1.6% during Q1. We are expecting a modest m/m increase in May's CEI. Payroll employment rose solidly during the month. Real personal income excluding transfer payments and real business sales edged up slightly last month. Only industrial production was down a bit.

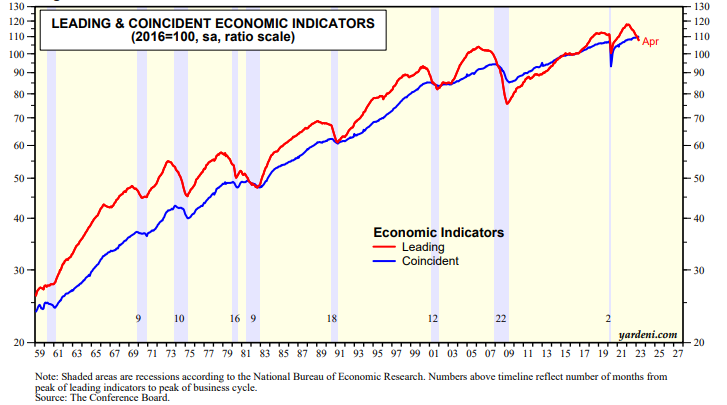
There's no recession in the CEI, but the Index of Leading Economic Indicators (LEI) has been signaling a recession for a while It peaked at a record high during December 2021 and fell 8.7% during April. It anticipated the past eight recessions by 12 months on average (chart).

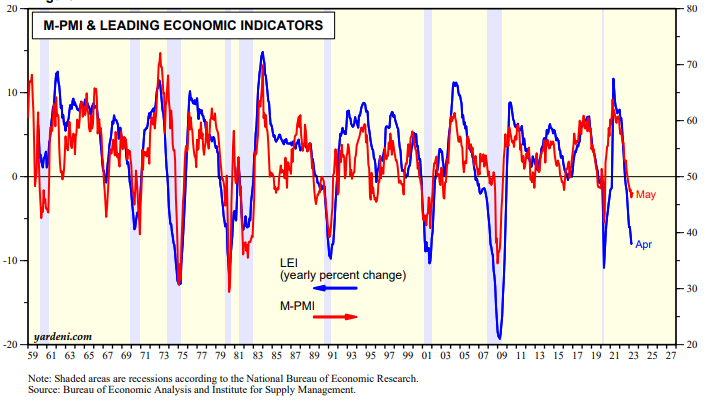
Why might it be different this time? The LEI could be due to be wrong because it is biased toward the goods sector of the economy (which is weak now) and doesn't give enough weight to the services sector (which is doing well). The LEI on a y/y basis is highly correlated with the M-PMI (chart).

The week's housing-related indicators include May's housing starts (Tue), May's existing home sales (Thu), and mortgage applications for the June 8 week. On balance, they should confirm that single-family housing remains weak but may be bottoming. Initial unemployment claims for the June 17 week may confirm the previous two weeks suggesting that the labor market is cooling.


