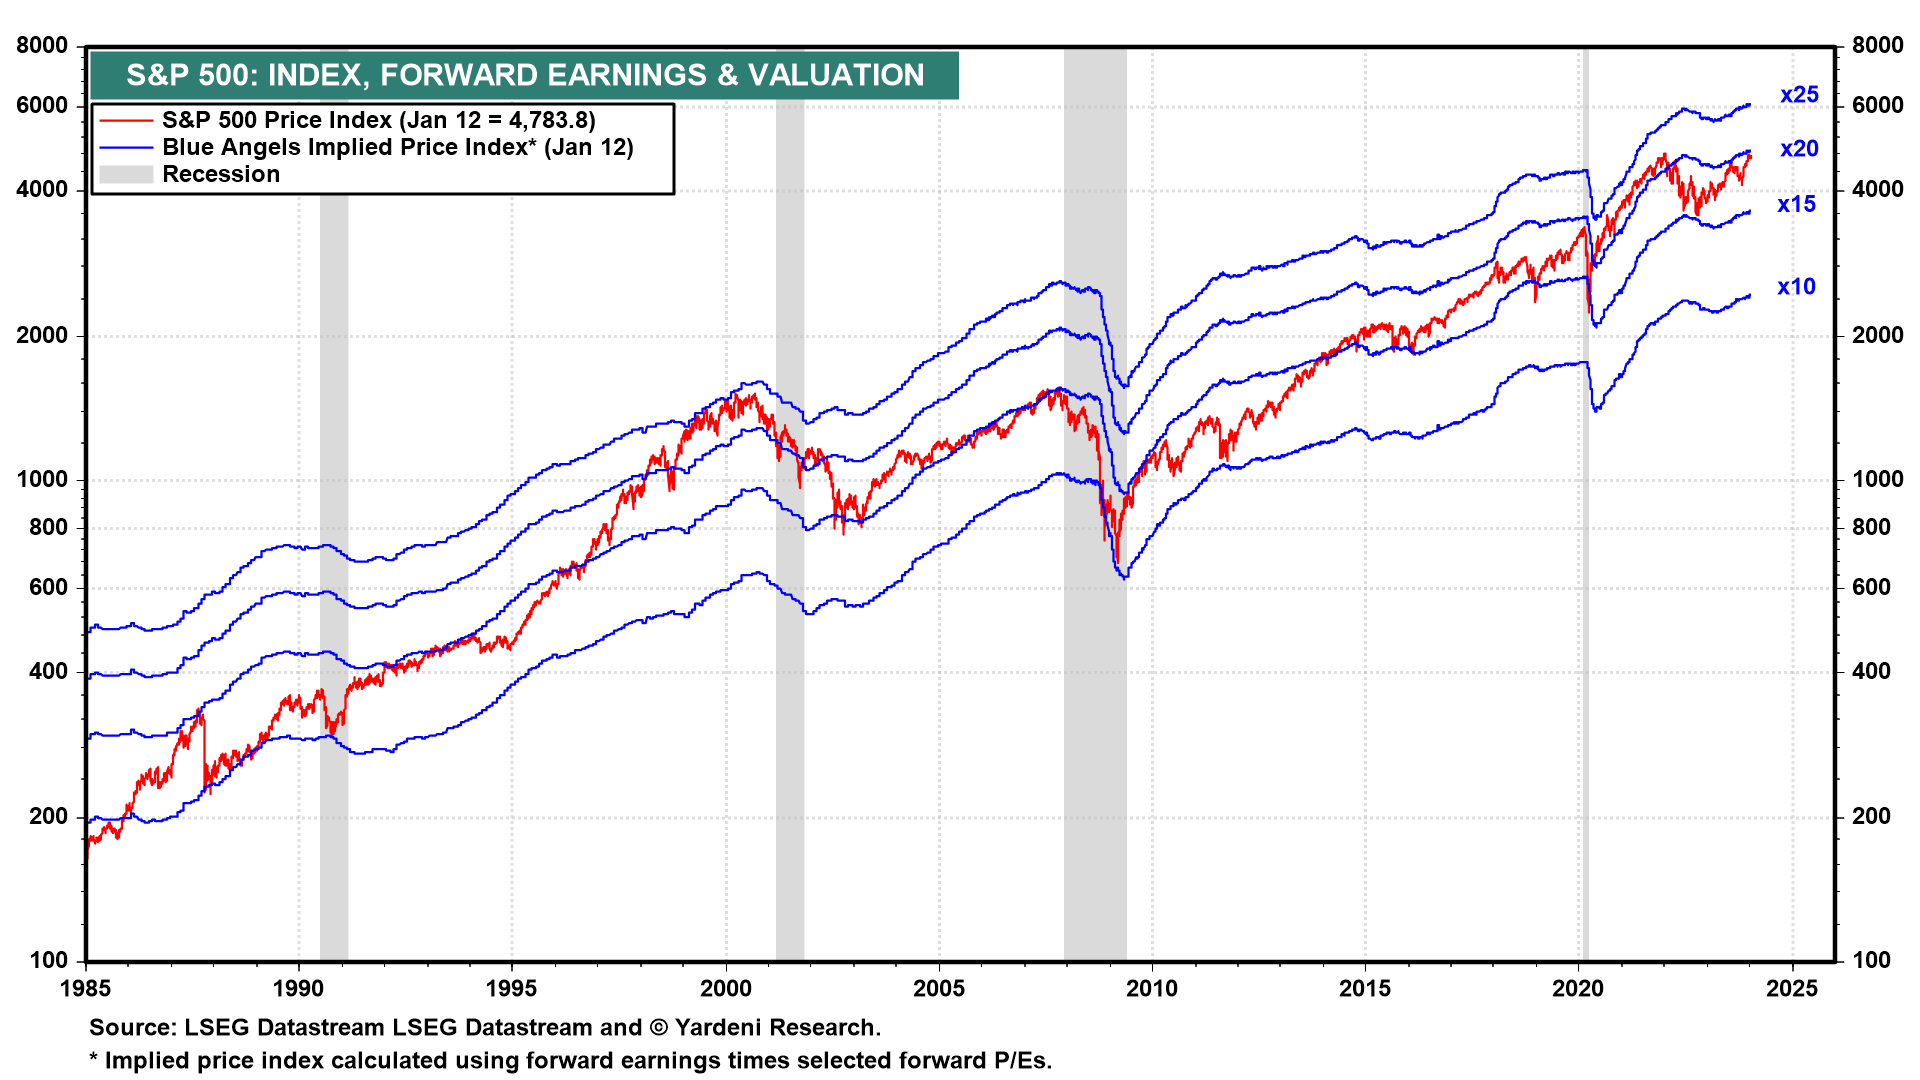
Our Blue Angels framework allows us to visualize the stock market equation P = P/E * E in one chart, where P is the stock price index, E is the forward earnings of the index, and P/E is the forward valuation multiple. Forward earnings is the time-weighted average of analysts' consensus earnings expectations for the current year and the coming year.
Our analysis of the Blue Angels is that the stock market needs time to consolidate its gains (i.e., the first half of this year) to allow earnings to catch up with stock prices. Let's see what we can see in the Blue Angels for the S&P 500/400/600:
(1) S&P 500 LargeCaps. The S&P 500 has almost fully recovered the ground lost since it peaked at a record high on January 3, 2022 (chart). Forward earnings slightly exceeds the record high during July 2022. The S&P 500's bull market since October 12, 2022 has been mostly attributable to a jump in the forward P/E from about 15 to almost 20.

Leer la noticia completa
Regístrese ahora para leer la historia completa y acceder a todas las publicaciones de pago.
Suscríbase a

