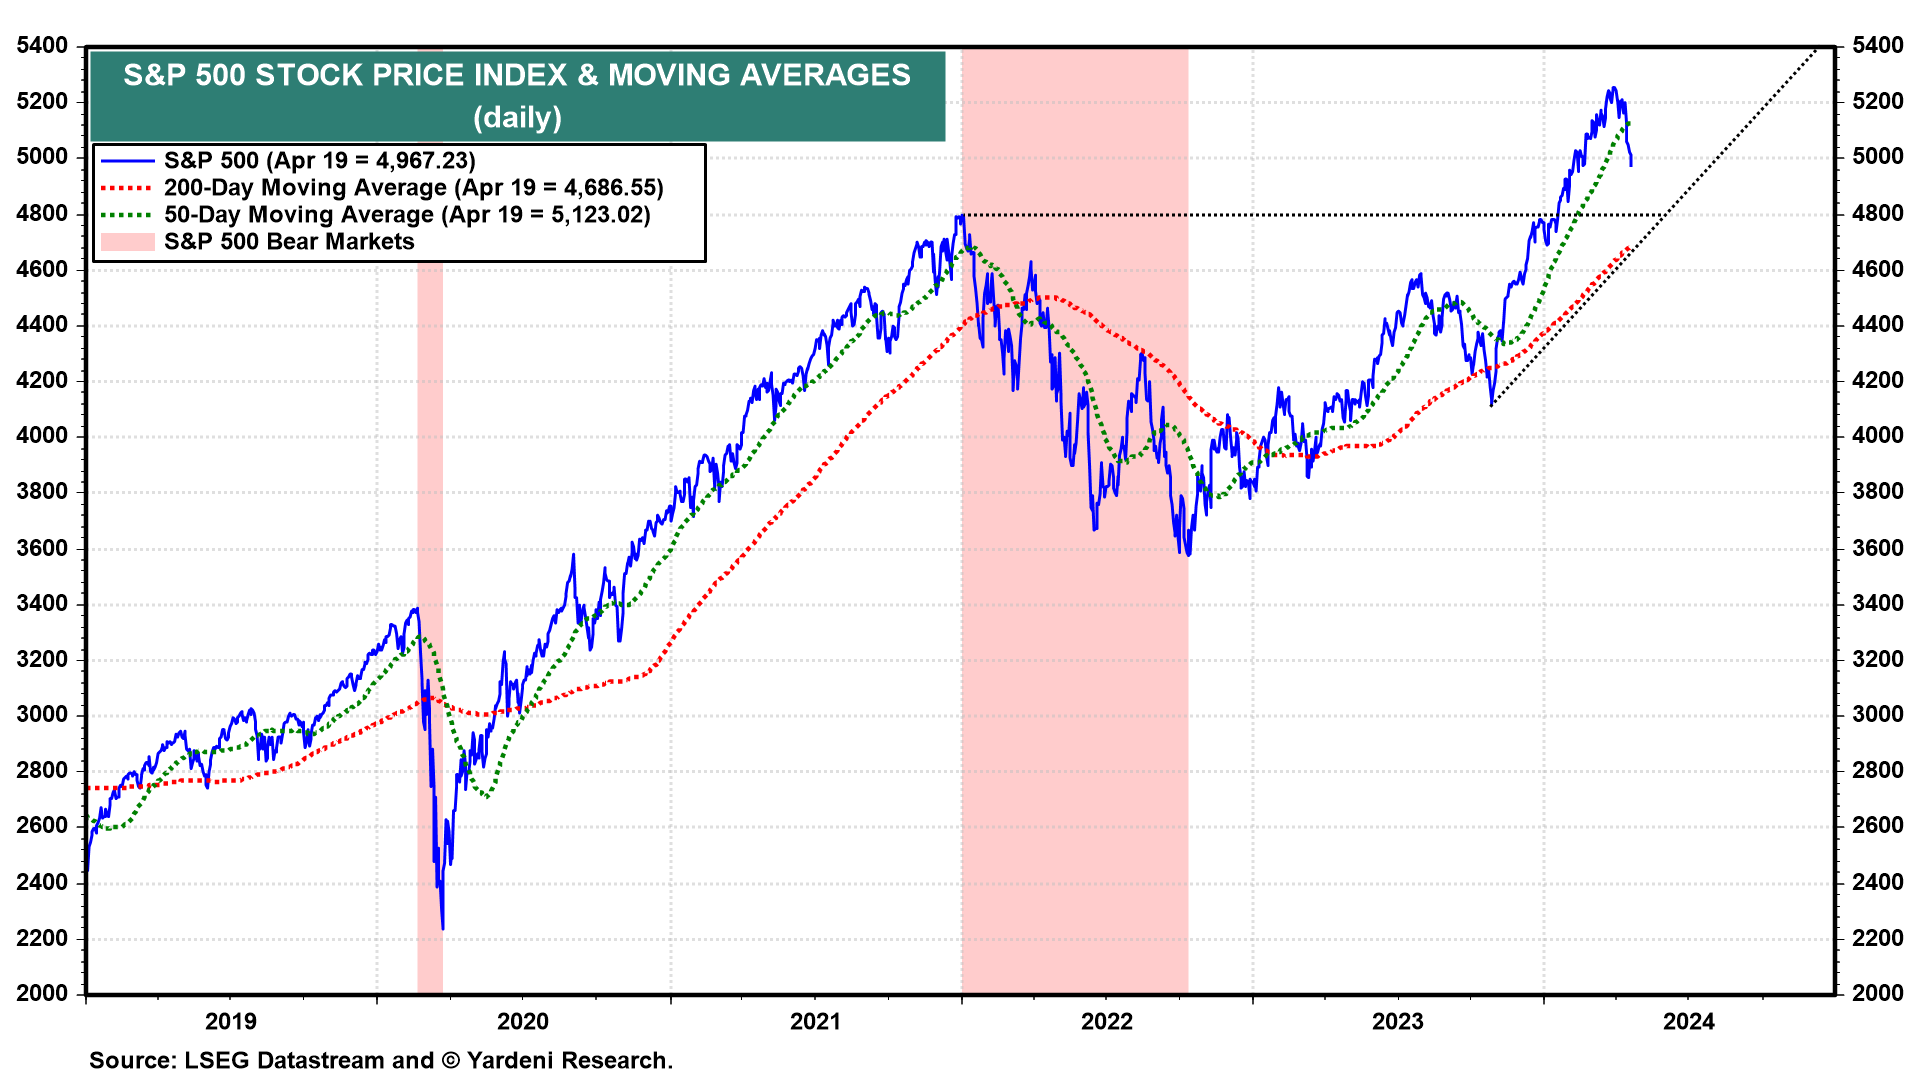
The S&P 500 is now down 5.5% from its March 28 record high. It dropped below its 50-day moving average (dma) last week (chart). Where might it find some technical support? It might do so around 4800, which would match the peak just before the previous bear market and put the index unchanged for the year so far. Below that level is the 200-dma, currently around 4700, which would be a 10.6% correction from the record high. Either way, we are still targeting 5400 for the end of this year, 6000 for the end of 2025, and 6500 for the end of 2026.
The current selloff is likely to continue this week. However, there could be a big rally on Friday if the March PCED inflation rate is lower than is widely expected--which is what we think could happen.

Leer la noticia completa
Regístrese ahora para leer la historia completa y acceder a todas las publicaciones de pago.
Suscríbase a

