Tomorrow will be May 1. We all know that April showers bring May flowers. There's also an old adage that advises stock investors to go away in May and come back in October. It worked last year, though January was the right month to go away.
The first part of this adage often worked. The problem is that the second part has been less reliable. Sometimes, when the market peaked in late April or early May, it bottomed during the summer. That's the problem with trading strategies aimed at picking peaks and troughs: You have to pick not only the tops, but also the bottoms. If you call the top right but don't get the bottom right, you might wind up getting back in to the market at the previous top or even higher.
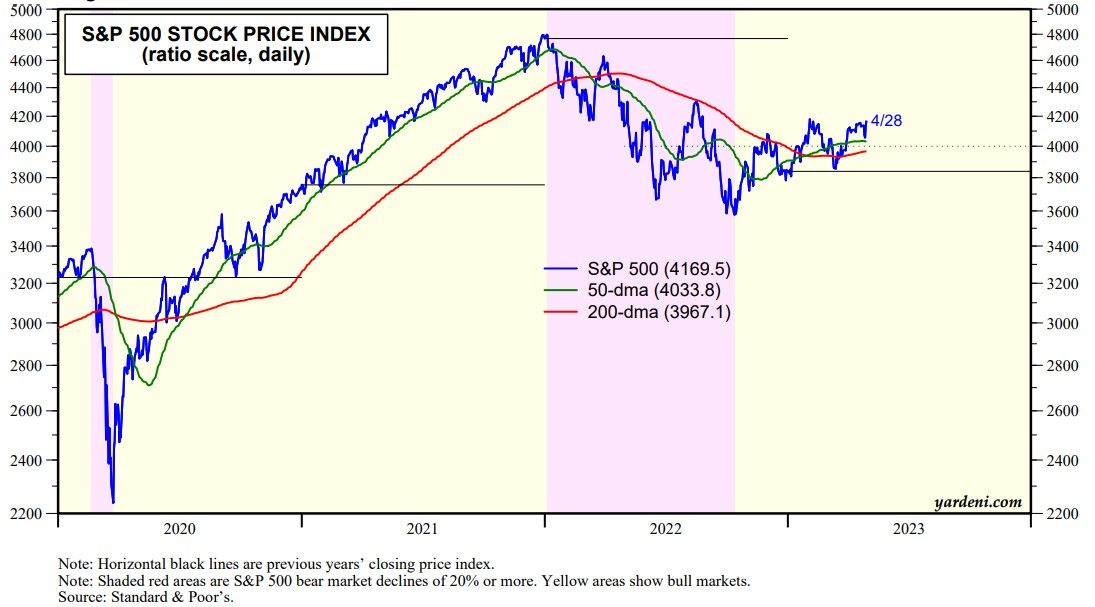
In our opinion, the S&P 500 may continue to churn around 4000 through the summer before resuming the bull market that started on October 12, 2022, more than six months ago (chart). Arguably, it has been churning around 4000 since last summer. Last week, it bounced off its 50-dma and closed near its February 2 high.

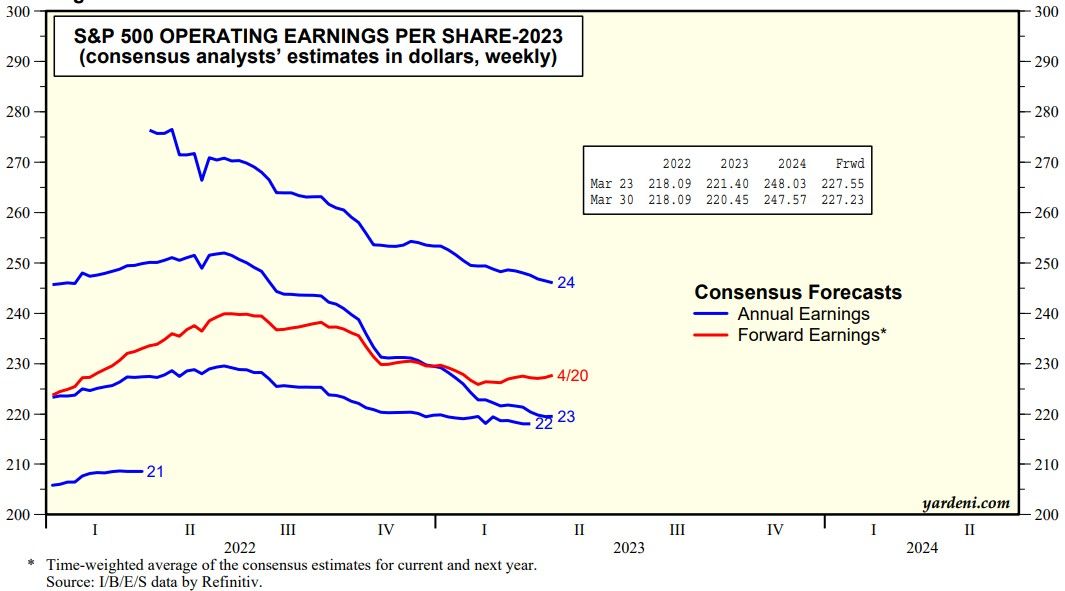
The S&P 500 has been range bound lately partly because its forward earnings has flattened out in recent weeks after falling during H2-2022 and the first few weeks of this year (chart).

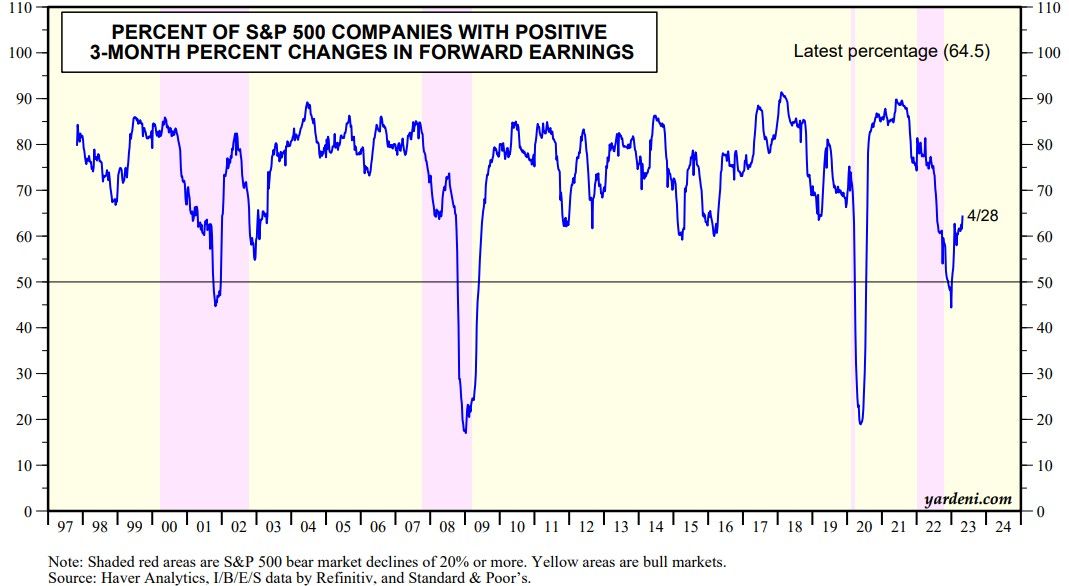
Meanwhile, our three-month measure of the breadth of S&P 500 forward earnings rose to a new high for this year of 64.5% during the April 28 week (chart). It bottomed at the end of last year at 45.0%. Analysts apparently read the recession memo and weren't convinced based on the relatively upbeat guidance offered by the managements of many of the companies they follow.

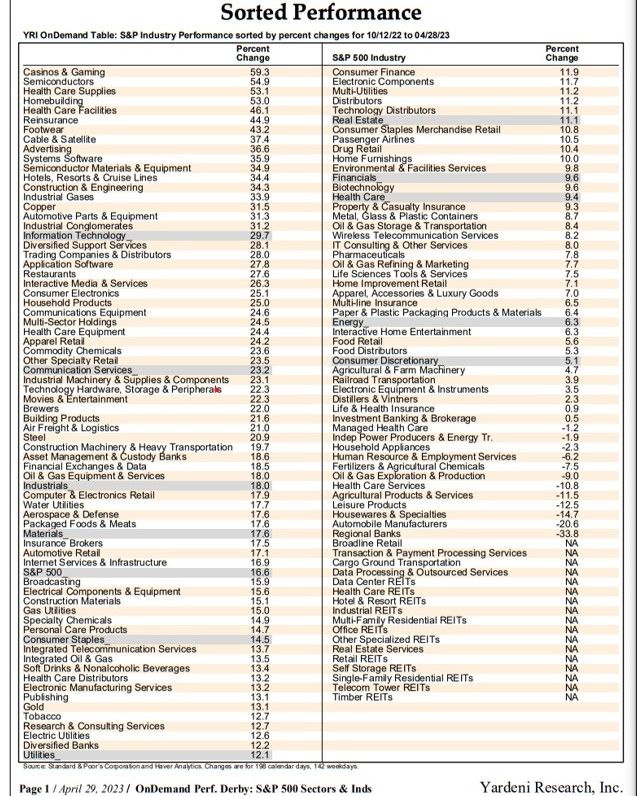
The bull market's detractors say that the breadth of the rally in the S&P 500 has been narrow with the MegaCap-8 stocks leading the way. Collectively, these stocks currently account for 24% of the market capitalization of the S&P 500. That's all true, but there are plenty of industries that don't include any of the MegaCap-8 that are up over 20% since October 12, 2022 (table).

Finally, we asked Joe Feshbach for his latest views on the stock market from a trading perspective: "The S&P is very close to its February 2 high, and should even take out its intraday high of 4195. The Nasdaq composite hasn't taken out its February high either yet even though the June Nasdaq futures did so a while ago. I've looked at lots of charts over the past 40+ years and the short term chart of the Nasdaq composite is about as good as a chart can be. Therefore in my mind 12269.5 should also be exceeded. The question is what happens if those highs are achieved? Last Tuesday and Wednesday, when the market declined, the put/call ratios recorded very high readings, suggesting that the consensus believed that a correction is starting. But then came Tech's great earnings reports. So between an improvement in the sentiment numbers and the very bullish short-term Nasdaq chart, there may still be some follow through after the highs are taken out. However, with the good earnings news coupled with the narrowness in breadth on this Nasdaq advance, I would expect the market to fall back into the wide trading range its been in for quite some time. Tech stocks were up well before the great earnings reports, so I view this as an 8th inning event not a 3rd inning event."


