
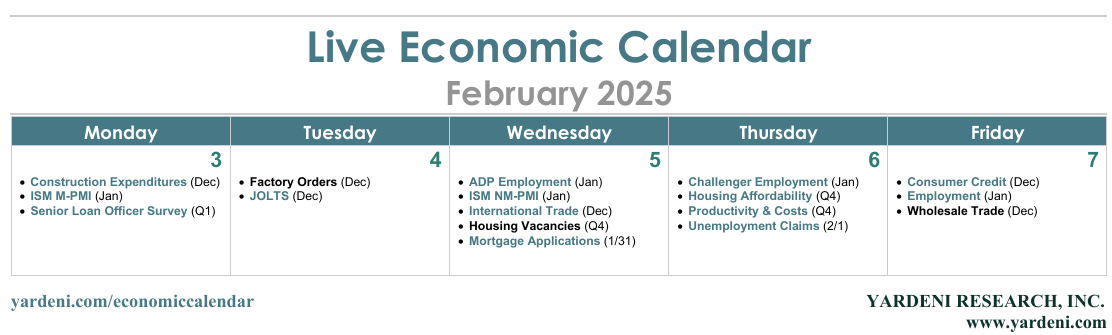
Aside from plenty of news about tariffs, the economic week ahead is jampacked with economic indicators that might be affected by tariffs in coming months. Capped off by January's monthly employment report on Friday, the week will also include releases on manufacturing, worker productivity, and bank lending.
We're expecting more strong employment data this week, consistent with our overall bullish outlook for the US economy. The impact of tariffs may show up in February's manufacturing and nonmanufacturing PMIs next month. Here's more:
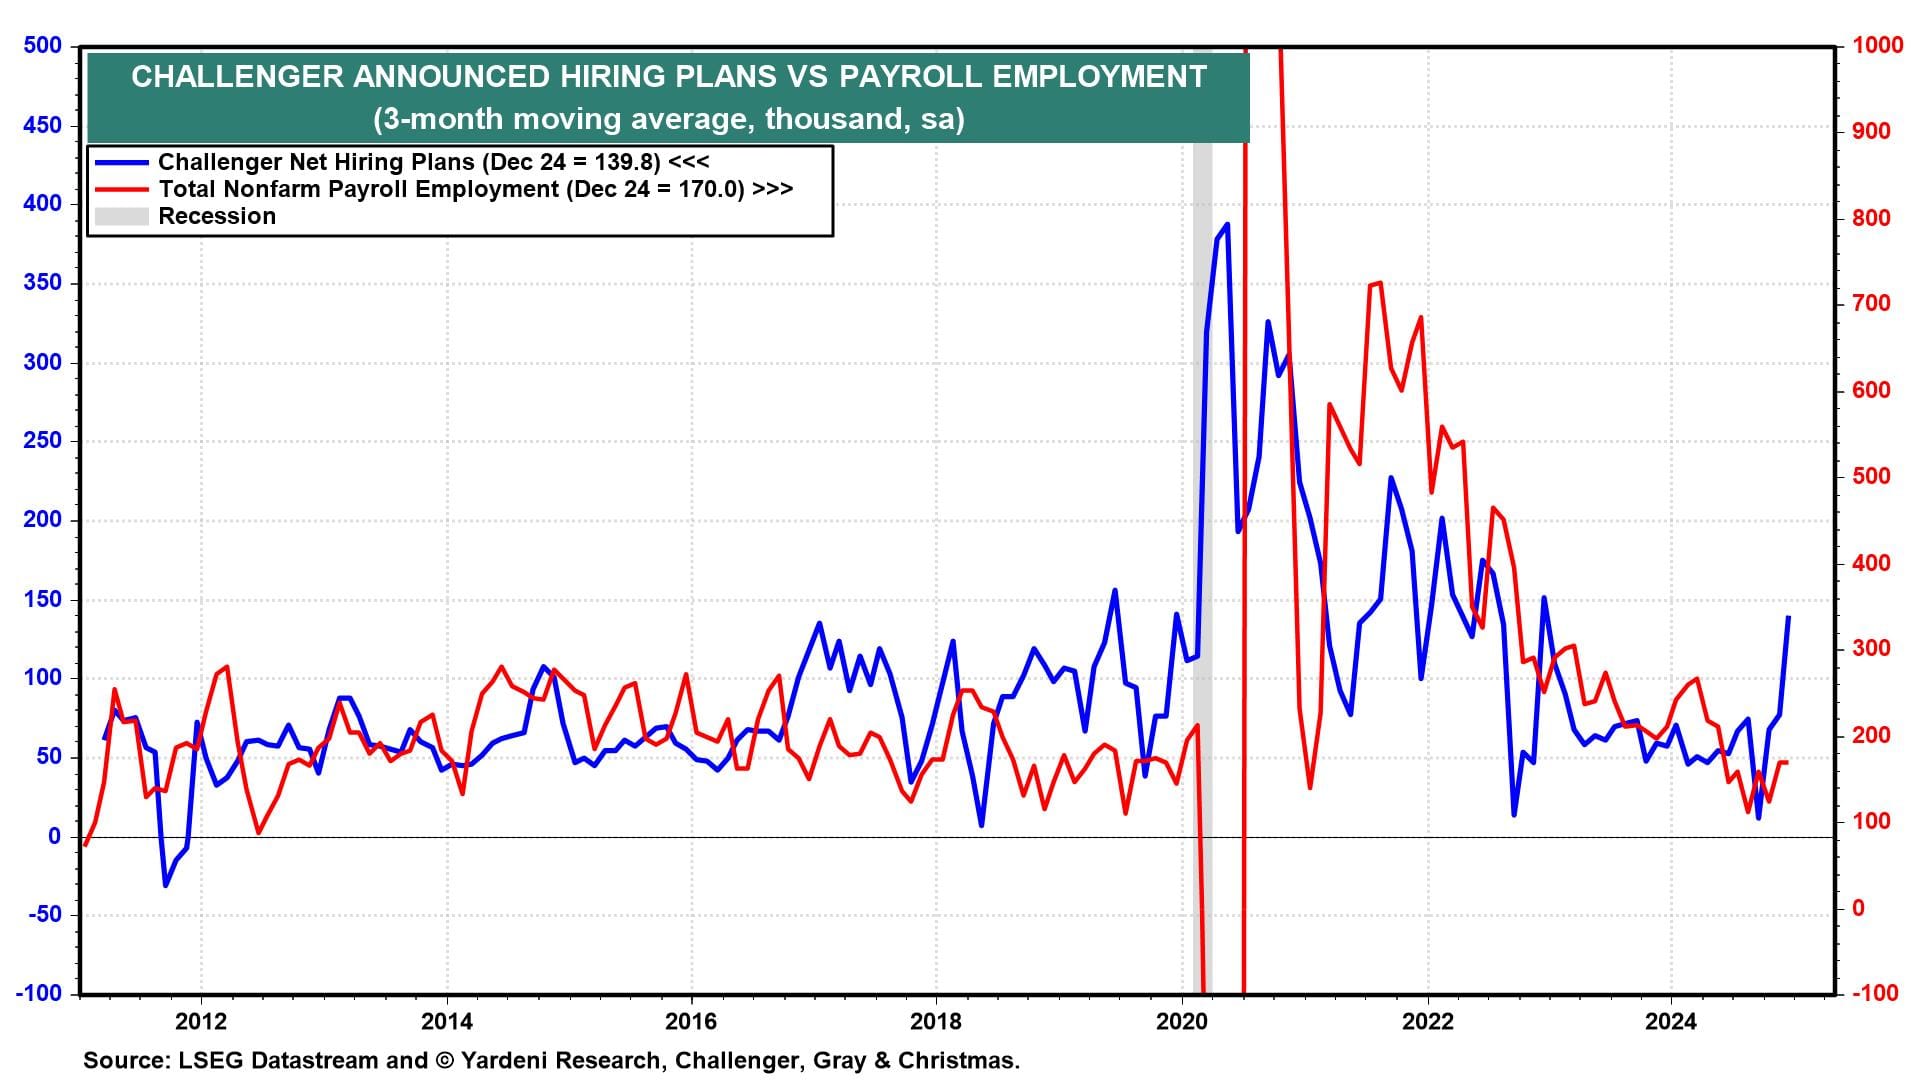
(1) Employment. We expect January's employment report (Fri) will beat expectations, rising around 175,000. The large jump in the three-month moving average through December of Challenger's net hiring plans series (Thu) suggests employers are eager to hire (chart).
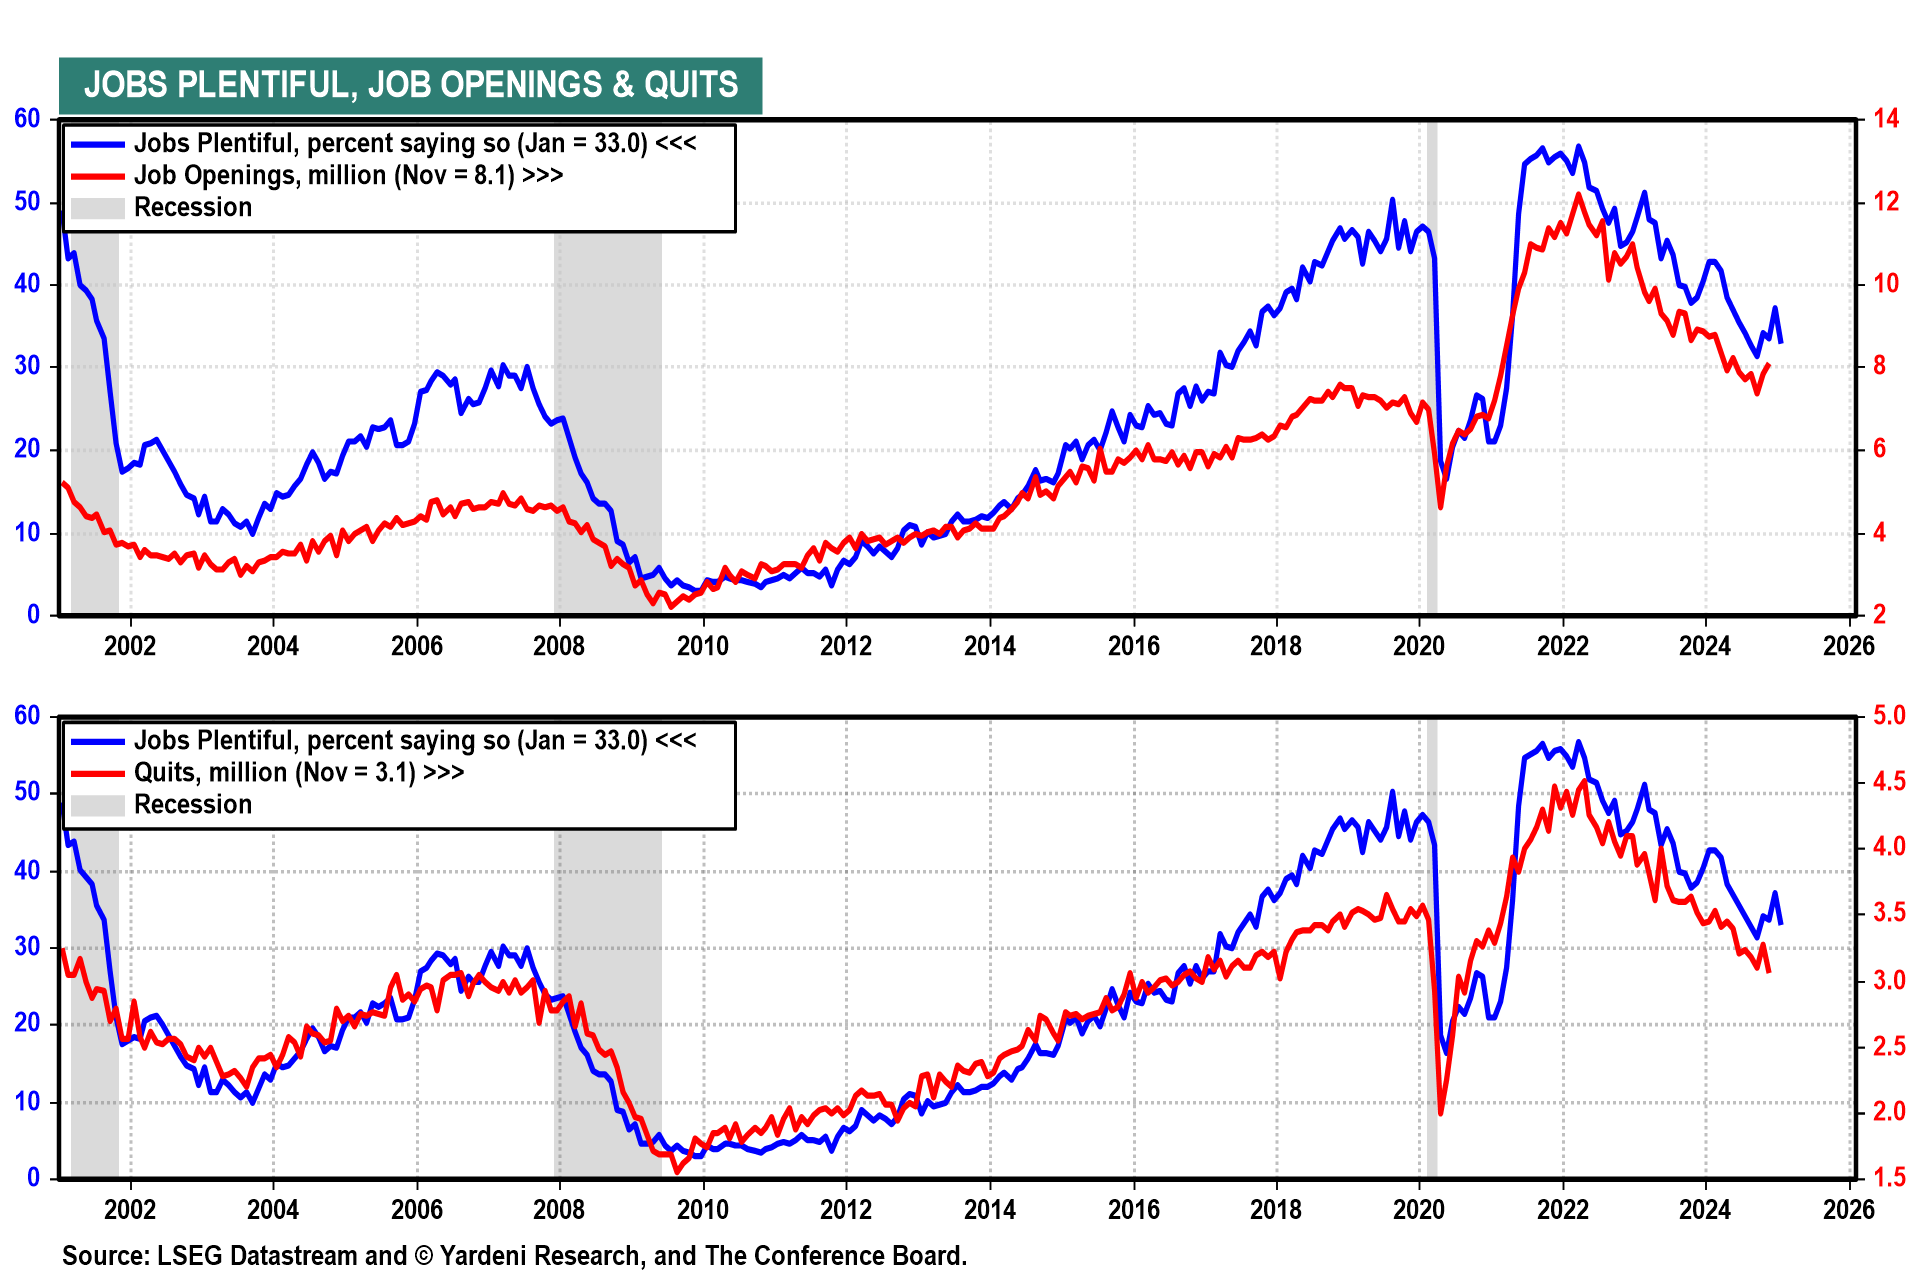
We doubt that immigration and deportation orders impacted January employment. In coming months, fewer undocumented workers might weigh on payroll employment gains without boosting the unemployment rate. Meanwhile, December's jump in the Conference Board’s "jobs plentiful" series will likely be reflected in December's JOLTS report (Tue) (chart).
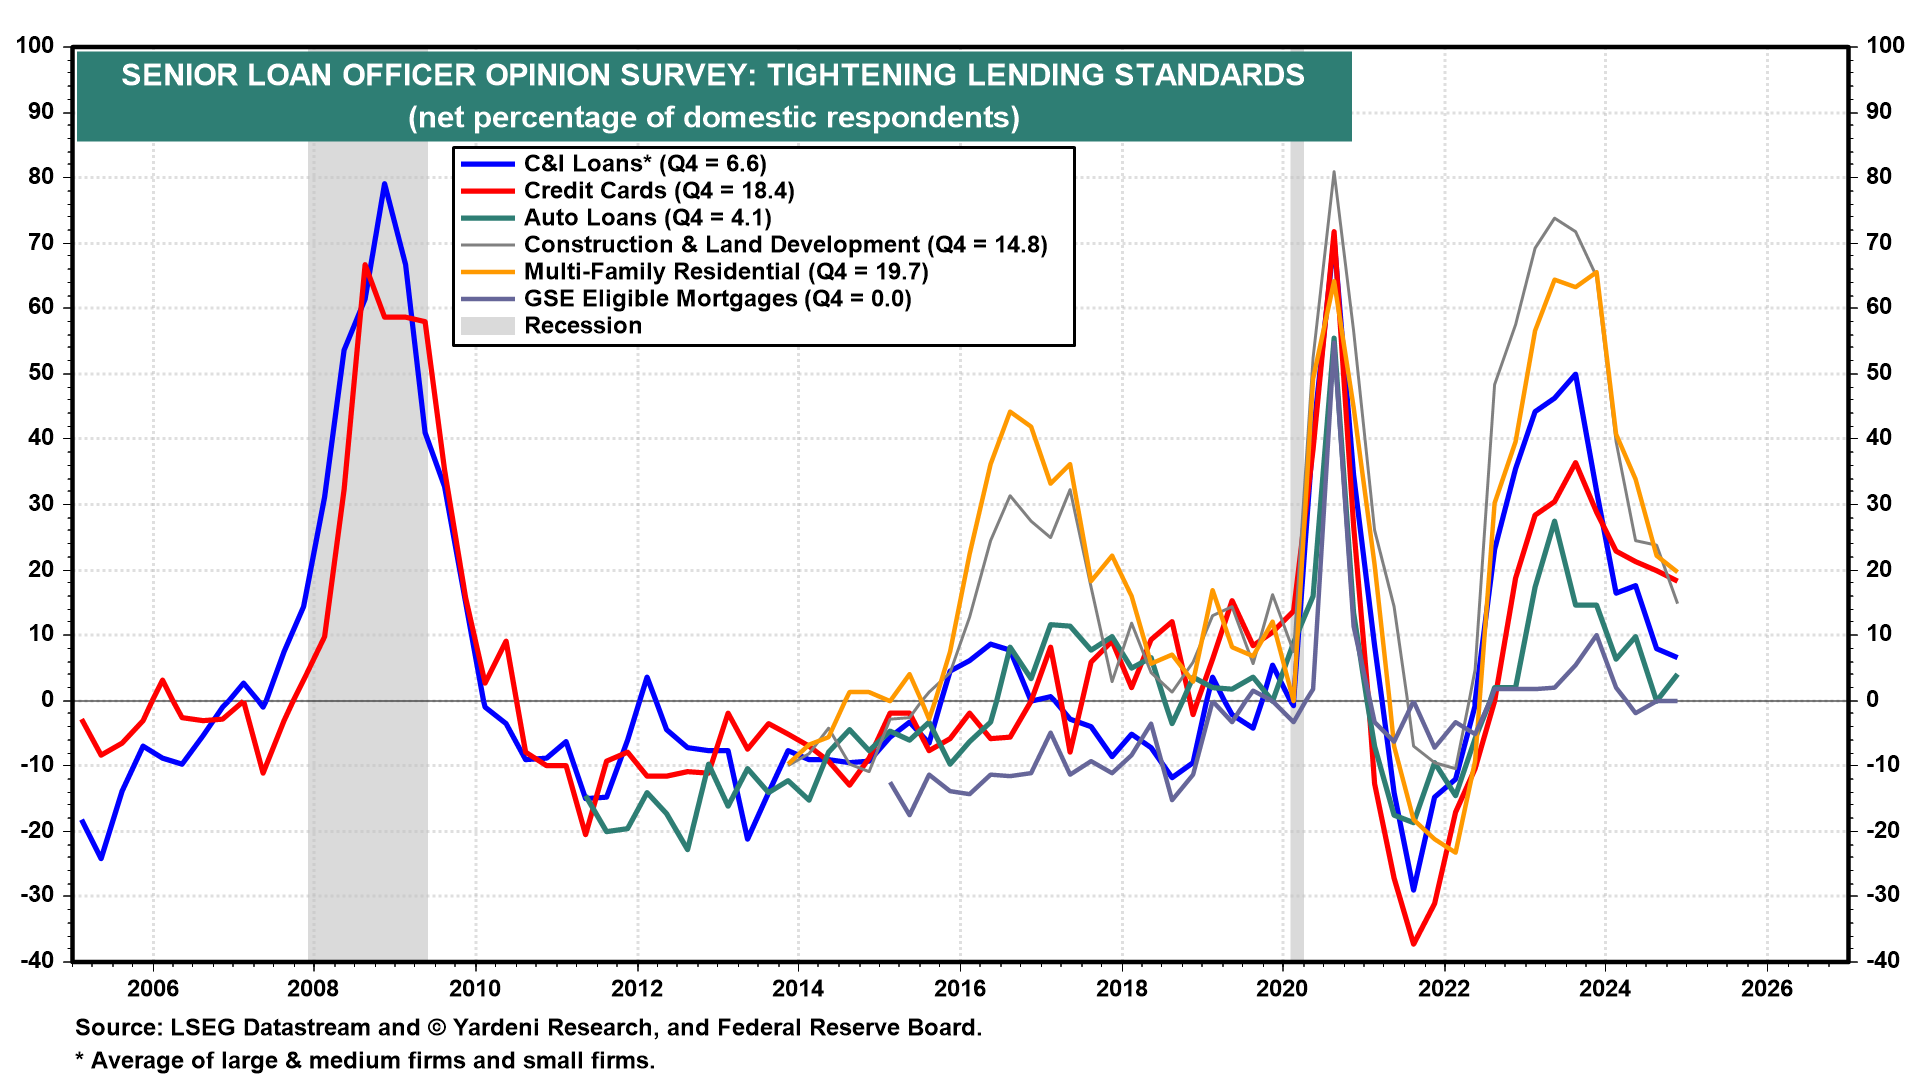
(2) Bank lending. We expect the Q1 Senior Loan Officer Opinion Survey (Mon) will show that lending conditions are easing and the cost of funding is falling (chart). That would aid the nascent rebound in manufacturing and other credit-sensitive businesses that have struggled since the Fed began tightening in 2022.
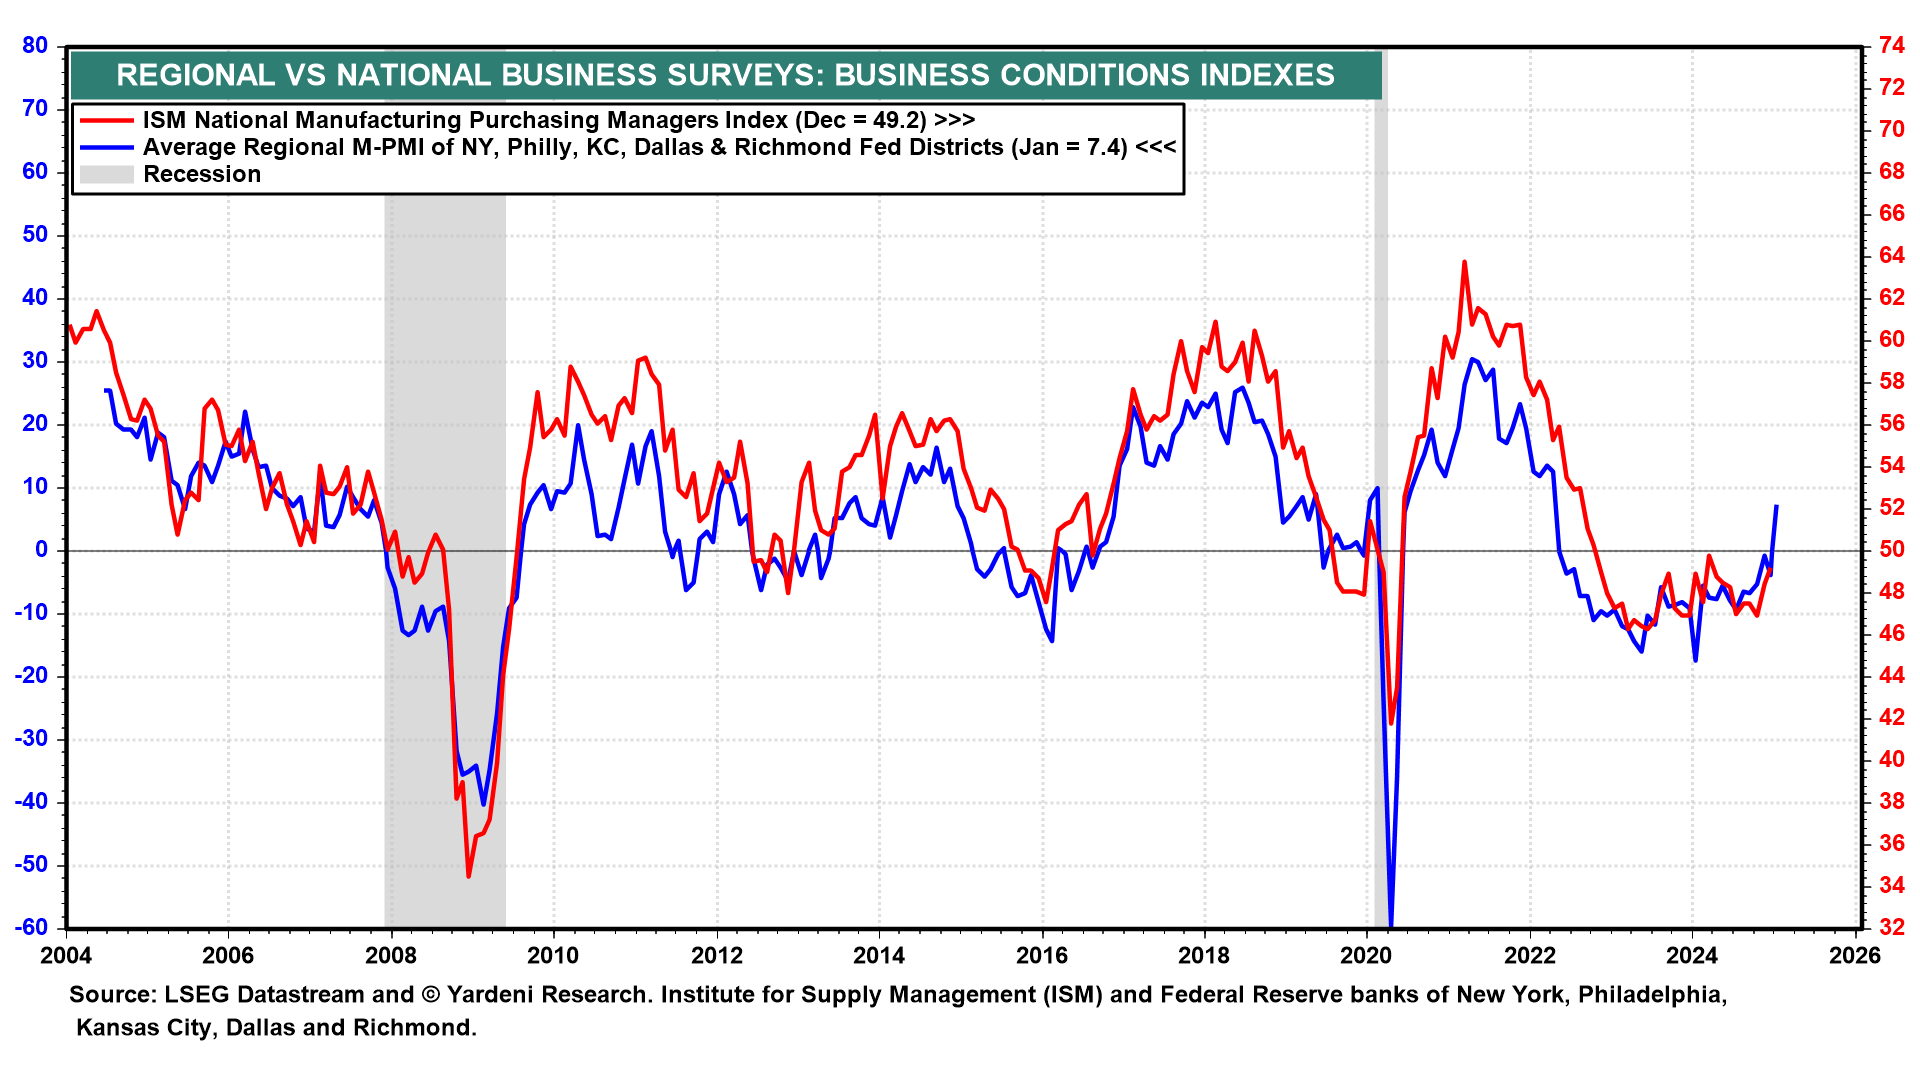
(3) Manufacturing. January's ISM M-PMI (Mon) may rise above 50.0 after three years in contraction. The new orders and production sub-indexes both were above 50.0 in December; and more importantly, the average of five key regional Federal Reserve banks’ M-PMIs was in expansion territory last month (chart). January's NM-PMI (Wed) likely was strong once again.
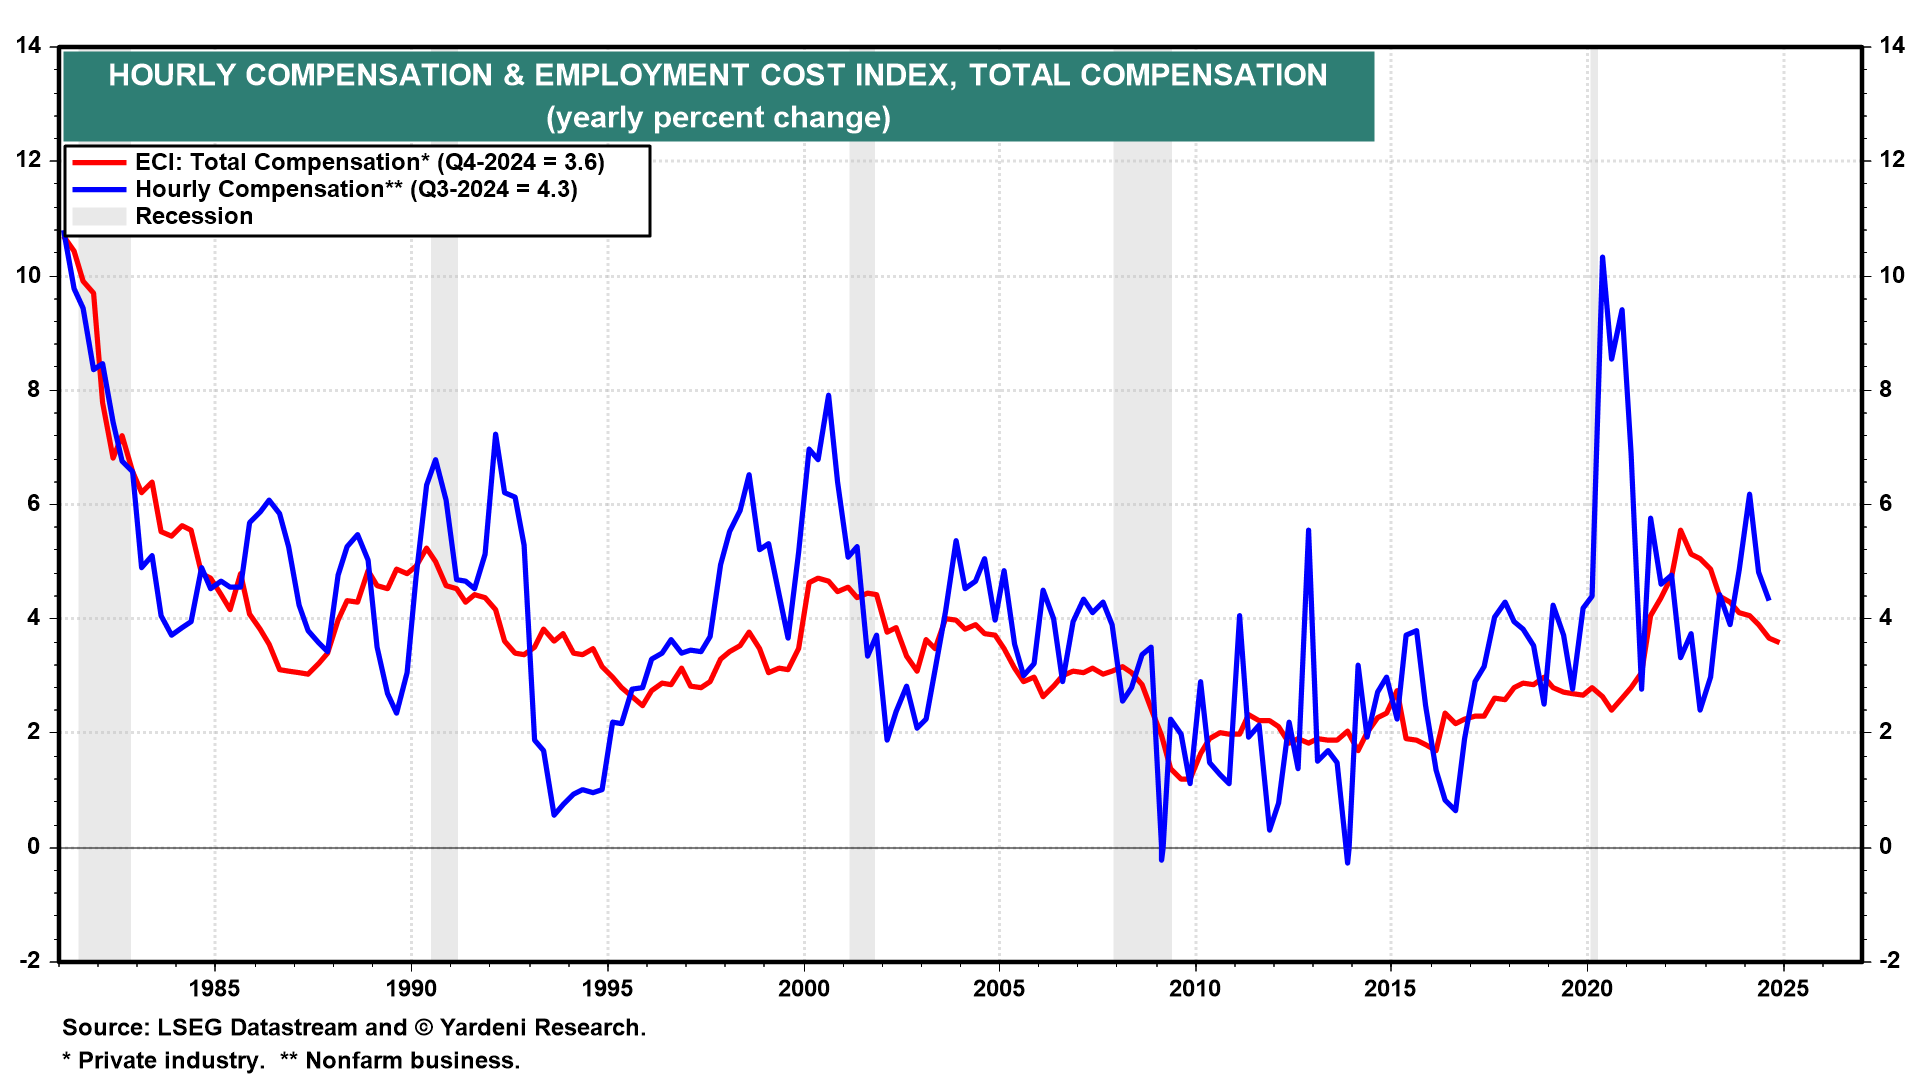
(4) Productivity and labor costs. We are keen to see Q4's worker productivity growth (Thu), though we recognize that the quarterly data are volatile. We expect productivity growth will breach 3.0% over the next few years, well above its historical average of 2.1% y/y. Hourly compensation inflation likely moderated a bit in Q4 alongside the decline in the Employment Cost Index inflation rate (chart).