


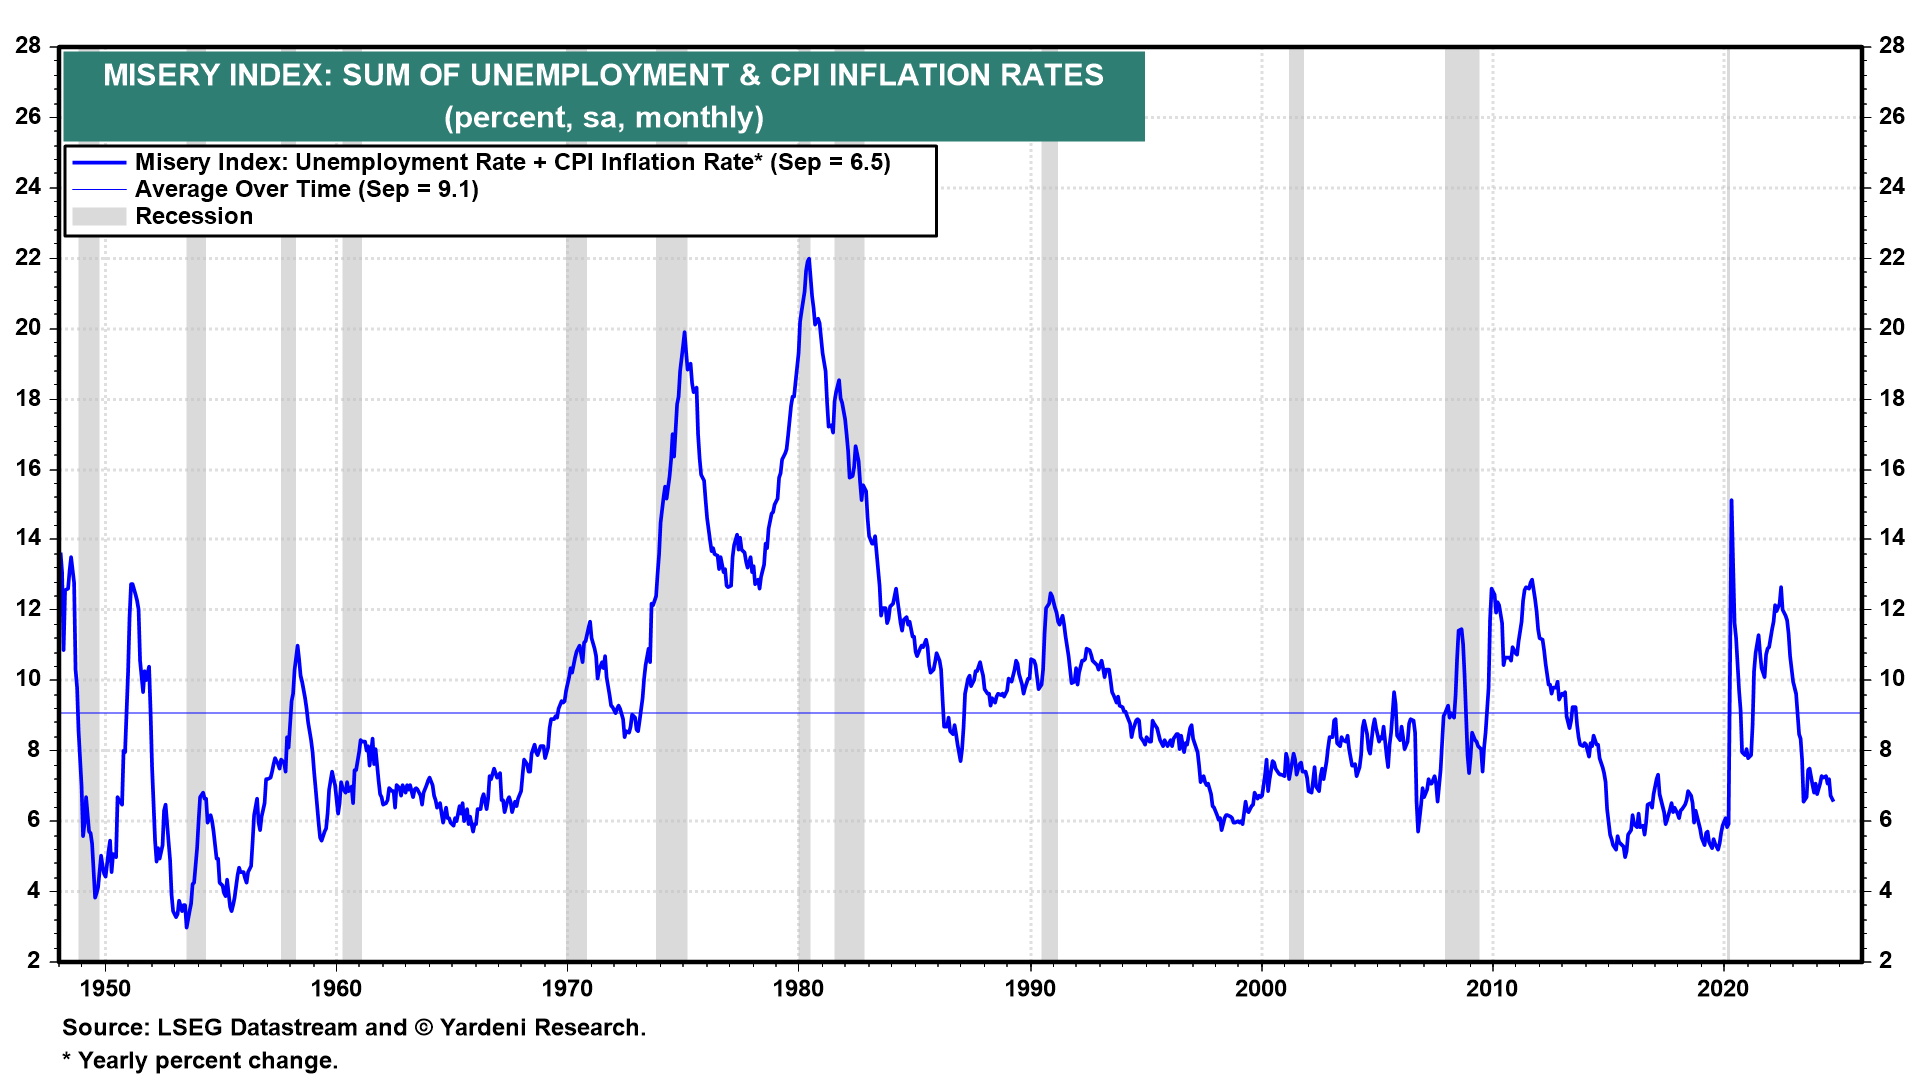
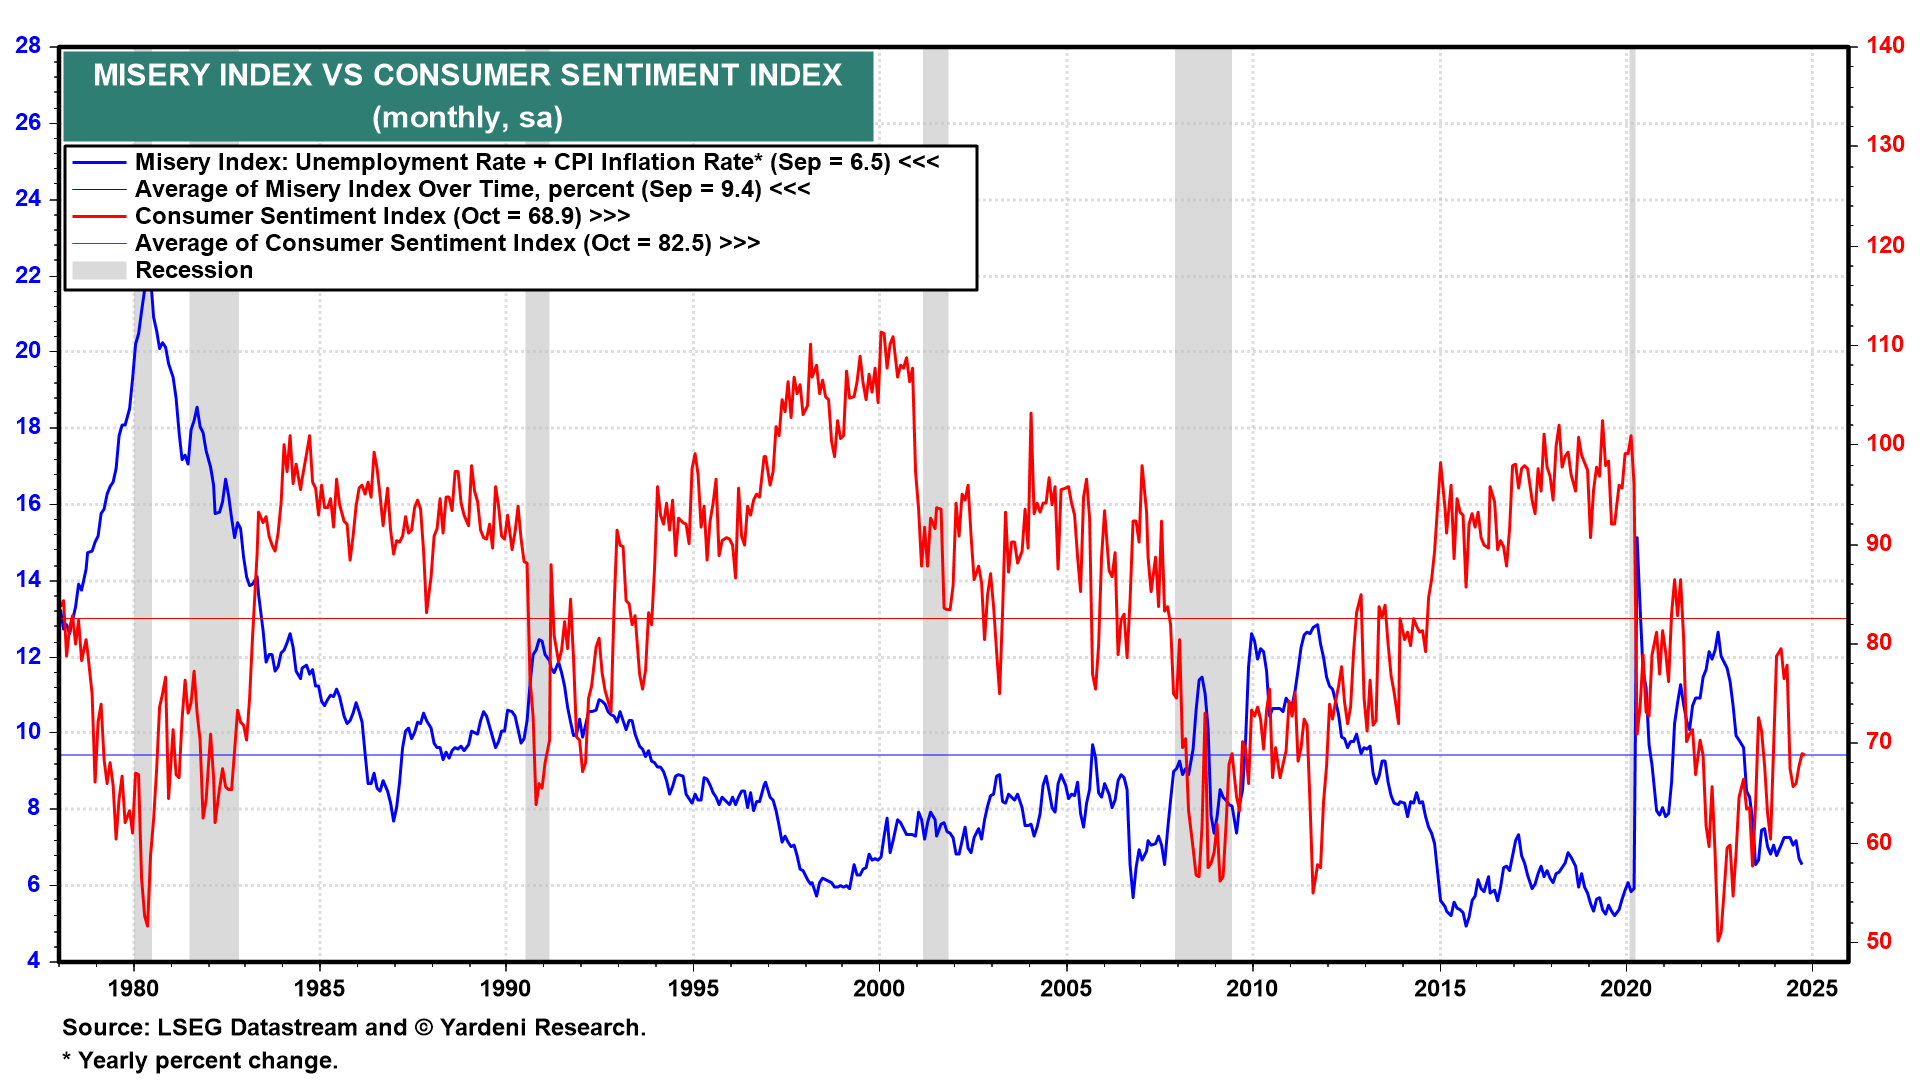
The Misery Index is the sum of the unemployment rate and the inflation rate (measured as the yearly percent change in the CPI) (Fig. 4 below). It was 6.5% during September, well below its average since 1947 of 9.1% (Fig. 5 below). So misery is relatively low. On the other hand, the Consumer Sentiment Index (CSI), which is inversely correlated with the Misery Index, was 68.9 during October, below its 82.5 average since 1978.
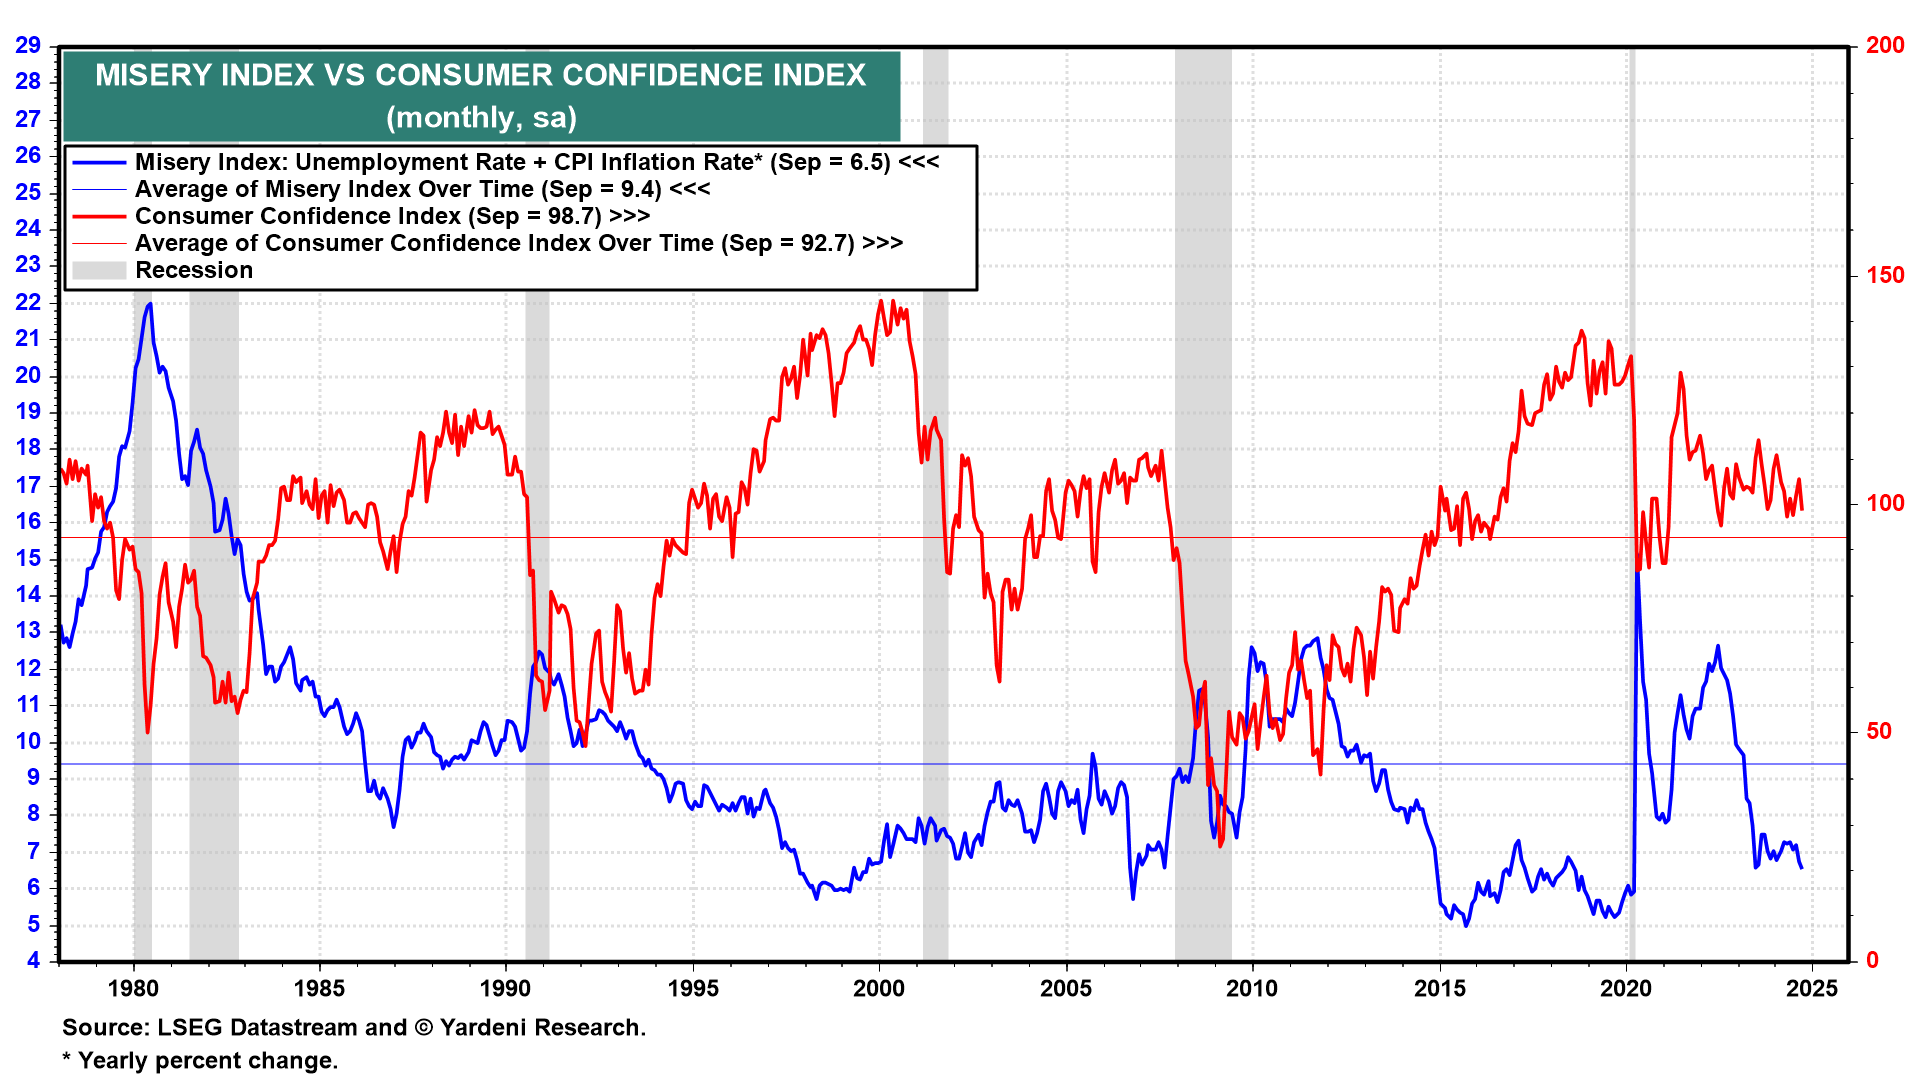
Debbie and I have found over the years that the CSI is more sensitive to inflation than the Consumer Confidence Index (CCI), which also is inversely correlated with the Misery Index but tends to be more sensitive to labor market conditions. The CCI is showing a happier reading of 98.7 during September, solidly above its 92.7 average since 1978 (Fig. 6 below).
Inflation over the past two years remains a sore point with consumers even though it has been moderating since last summer and even though wage gains have mostly kept pace with price increases.
Consider the following ten points:
(1) Since the start of the pandemic during March 2020 through September of this year, the CPI is up 21.9%, with CPI goods and CPI services up 20.3% and 22.8%, respectively (Fig. 7 and Fig. 8). Interestingly, the CPI goods price level has been flat since June 2022. However, the CPI services price level has continued to rise since then, led by its shelter component.
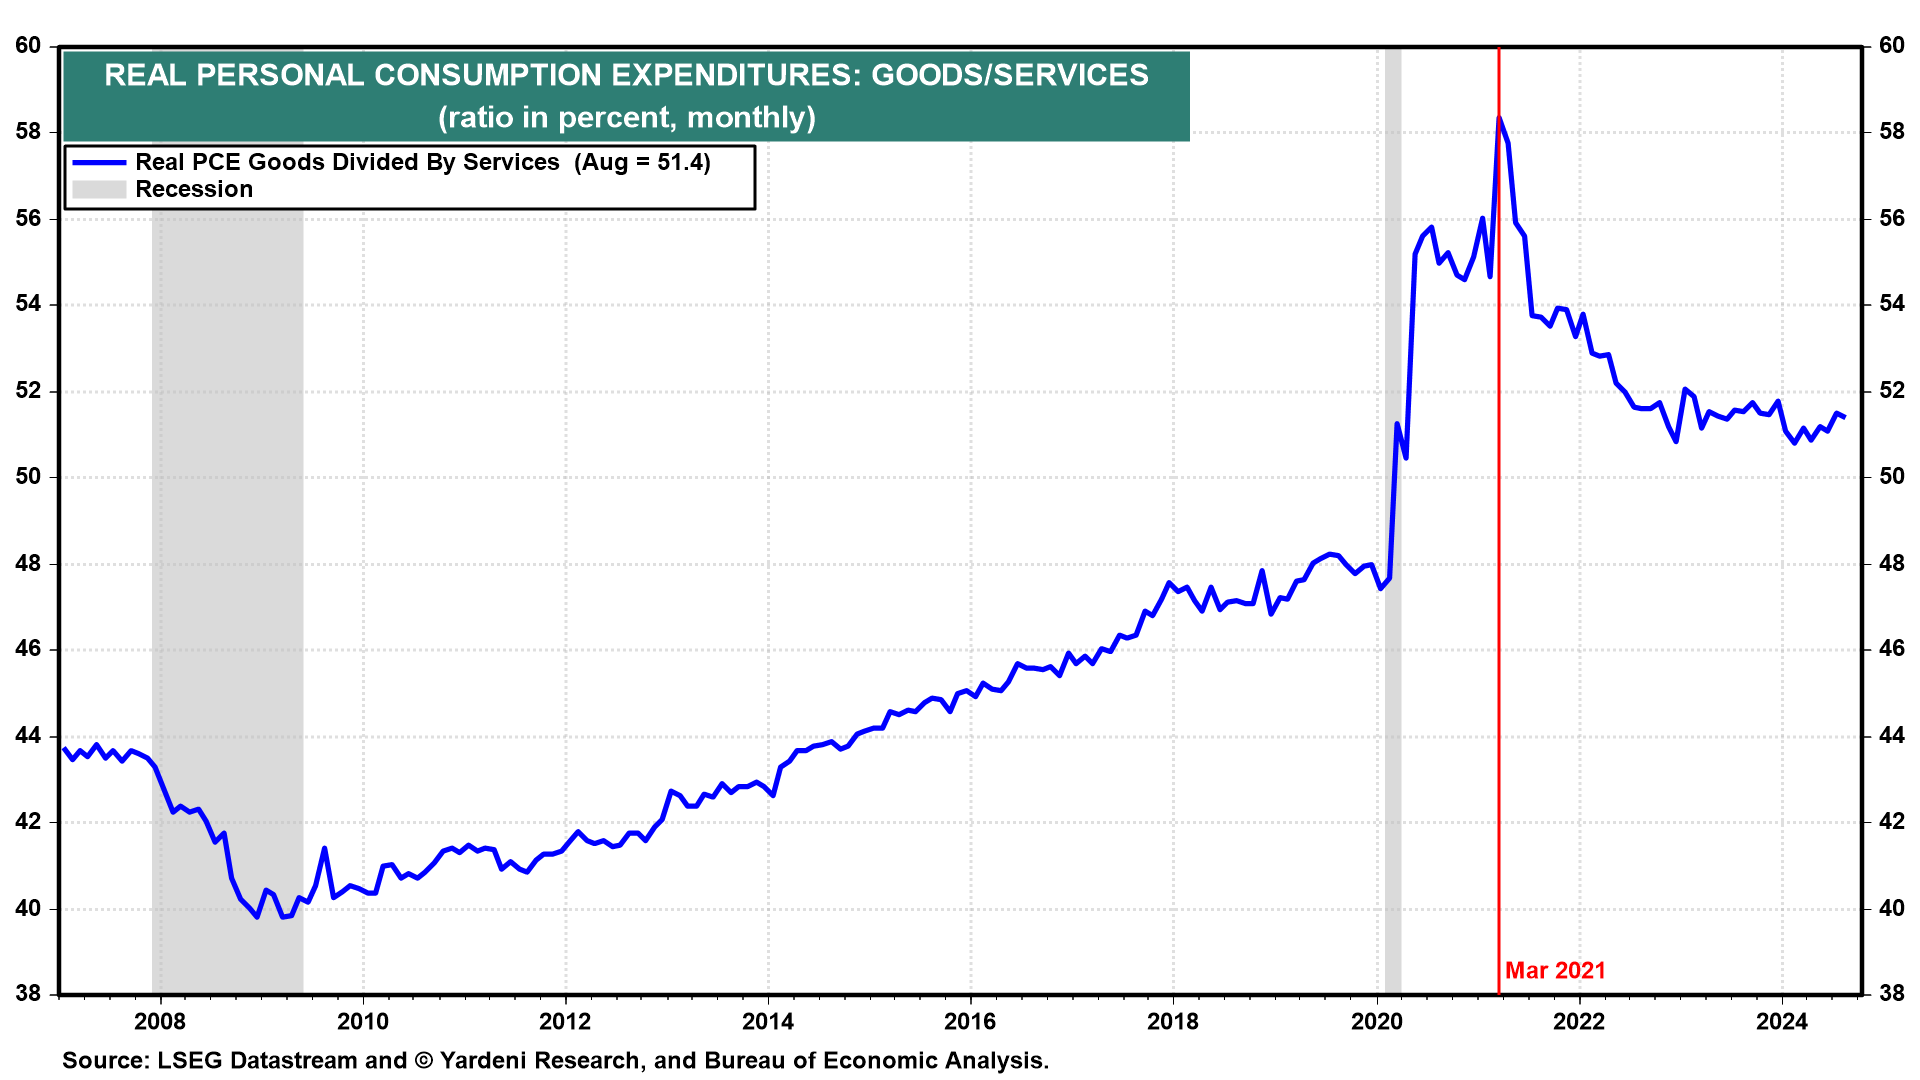
The post-lockdown consumer buying binge on goods peaked during the spring of 2021 as consumers pivoted to spending more on services (Fig. 9 below). Roughly one year later, supply-chain disruptions dissipated, and consumer goods prices flattened, albeit at record highs.
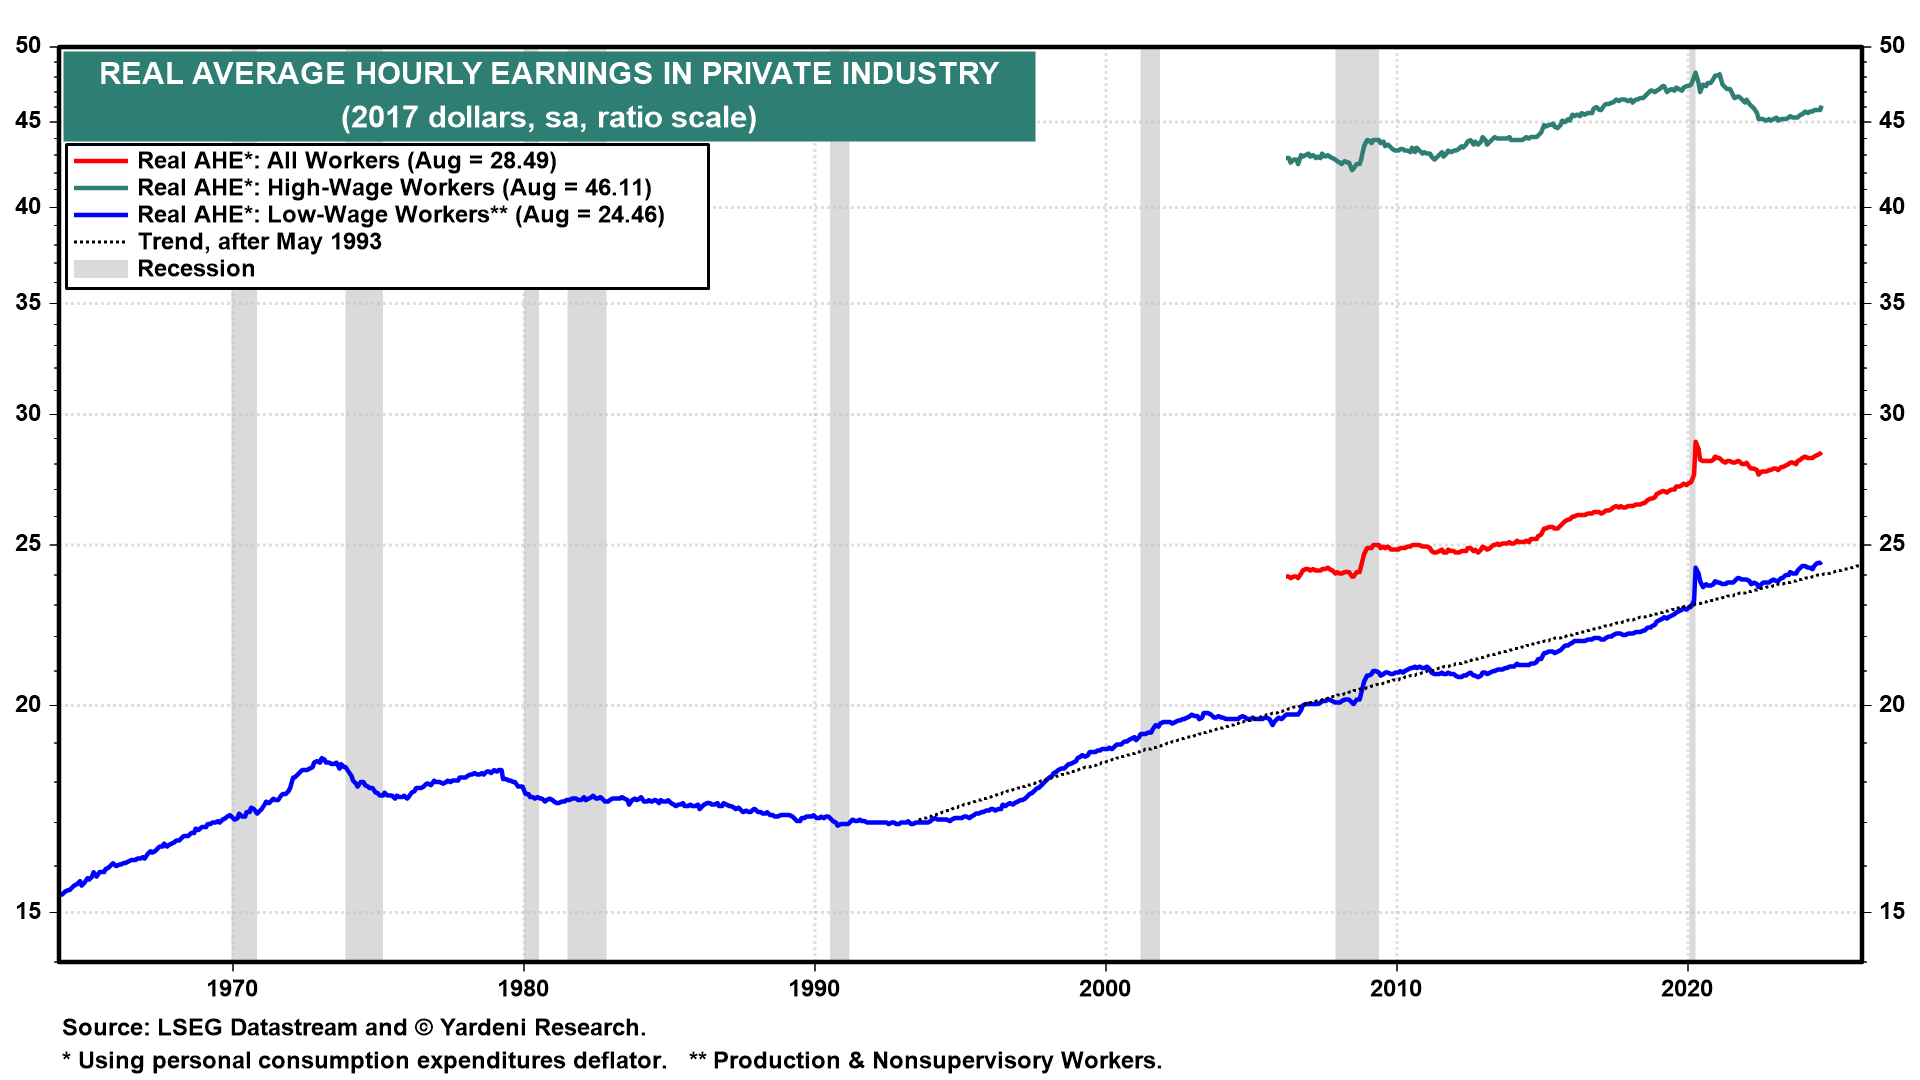
(2) Wages stagnated relative to prices during the pandemic years of 2020-22 but started to slightly outpace prices during 2023 (Fig. 10 below). In fact, average hourly earnings for all workers rose 22.9% since the start of the pandemic during March 2020 through September of this year. That’s slightly ahead of the CPI inflation rate.
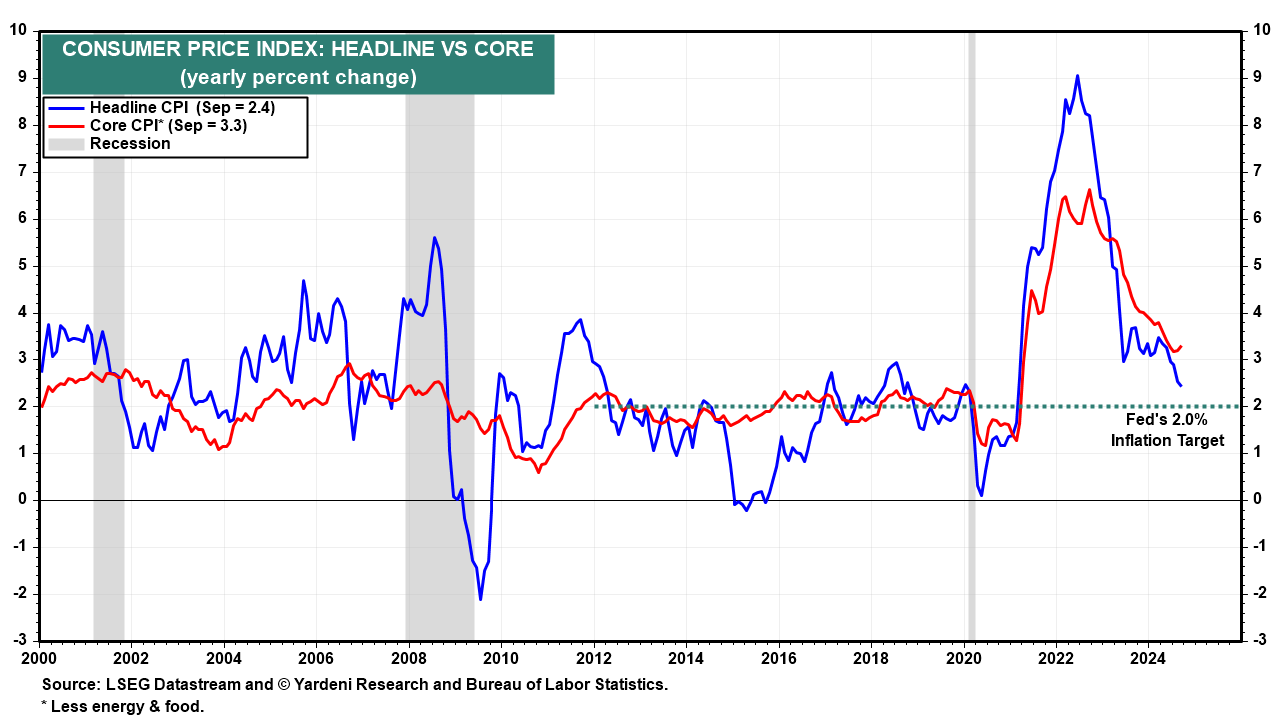
(4) So why is the Consumer Sentiment Index still relatively depressed? Inflation remains a problem for lots of consumers. According to a September 11-16, 2024 Bankrate survey, 41% of Americans say inflation is their No. 1 economic issue. Economists (including most policymakers) measure inflation on a year-over-year basis and are pleased to see that it has subsided significantly since it peaked during the summer of 2022. They note that the headline CPI inflation rate peaked at 9.1% y/y during June 2022 and fell to 2.4% in 2024 (Fig. 11 below).
However, many consumers compare today’s prices to what they were at the start of the pandemic. The CPI is up 21.9% since then (Fig. 12). That’s actually slightly below the 22.9% increase in hourly wages for all workers over the same period. However, the prices of essentials have increased by more since the pandemic. The CPI components for energy and food are up 34.3% and 26.3% since March 2020. Here are the CPI price increases in various essentials since the pandemic: gasoline (36.1%), motor vehicle maintenance & repairs (35.2%), rent of primary residence (24.9%), furnishings (19%), and auto insurance (18.8%) (Fig. 13).
(5) In his March 15 Barron’s column, Randy Forsyth also examined why consumers seem to be unhappy. He concluded: “The free lunch of historically low interest is over. Even as unemployment remains low and the CPI has receded from its four-decade pandemic peak, normalized interest costs weigh on Americans’ budgets. And they’re not happy about it, even with stock prices at records.”
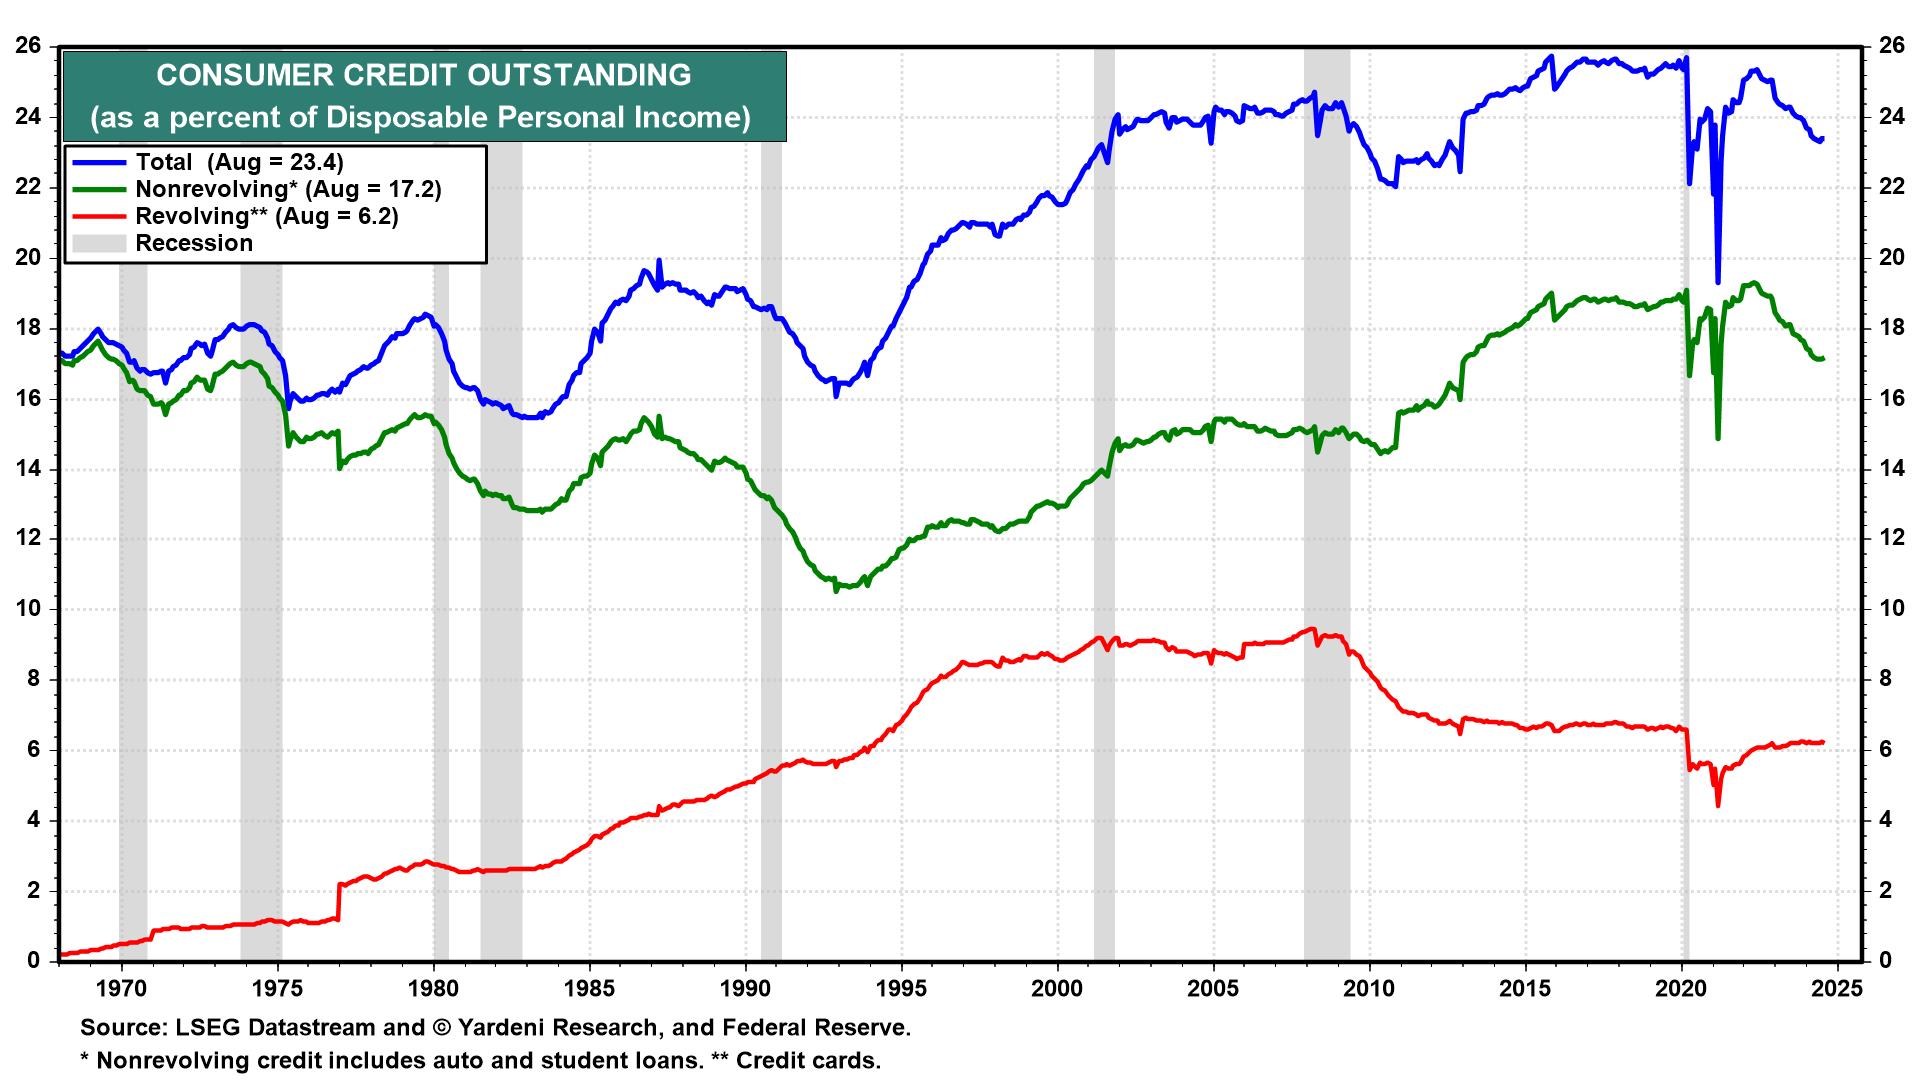
(6) Another concern about the outlook for consumer spending expressed by many economists is that consumer credit is at a record high of $5.1 trillion. That’s true, but it isn’t at a record high relative to disposable personal income (Fig. 14 below). Besides, the level of consumer debt has never caused a recession, though it did exacerbate several recessions that occurred for other reasons.
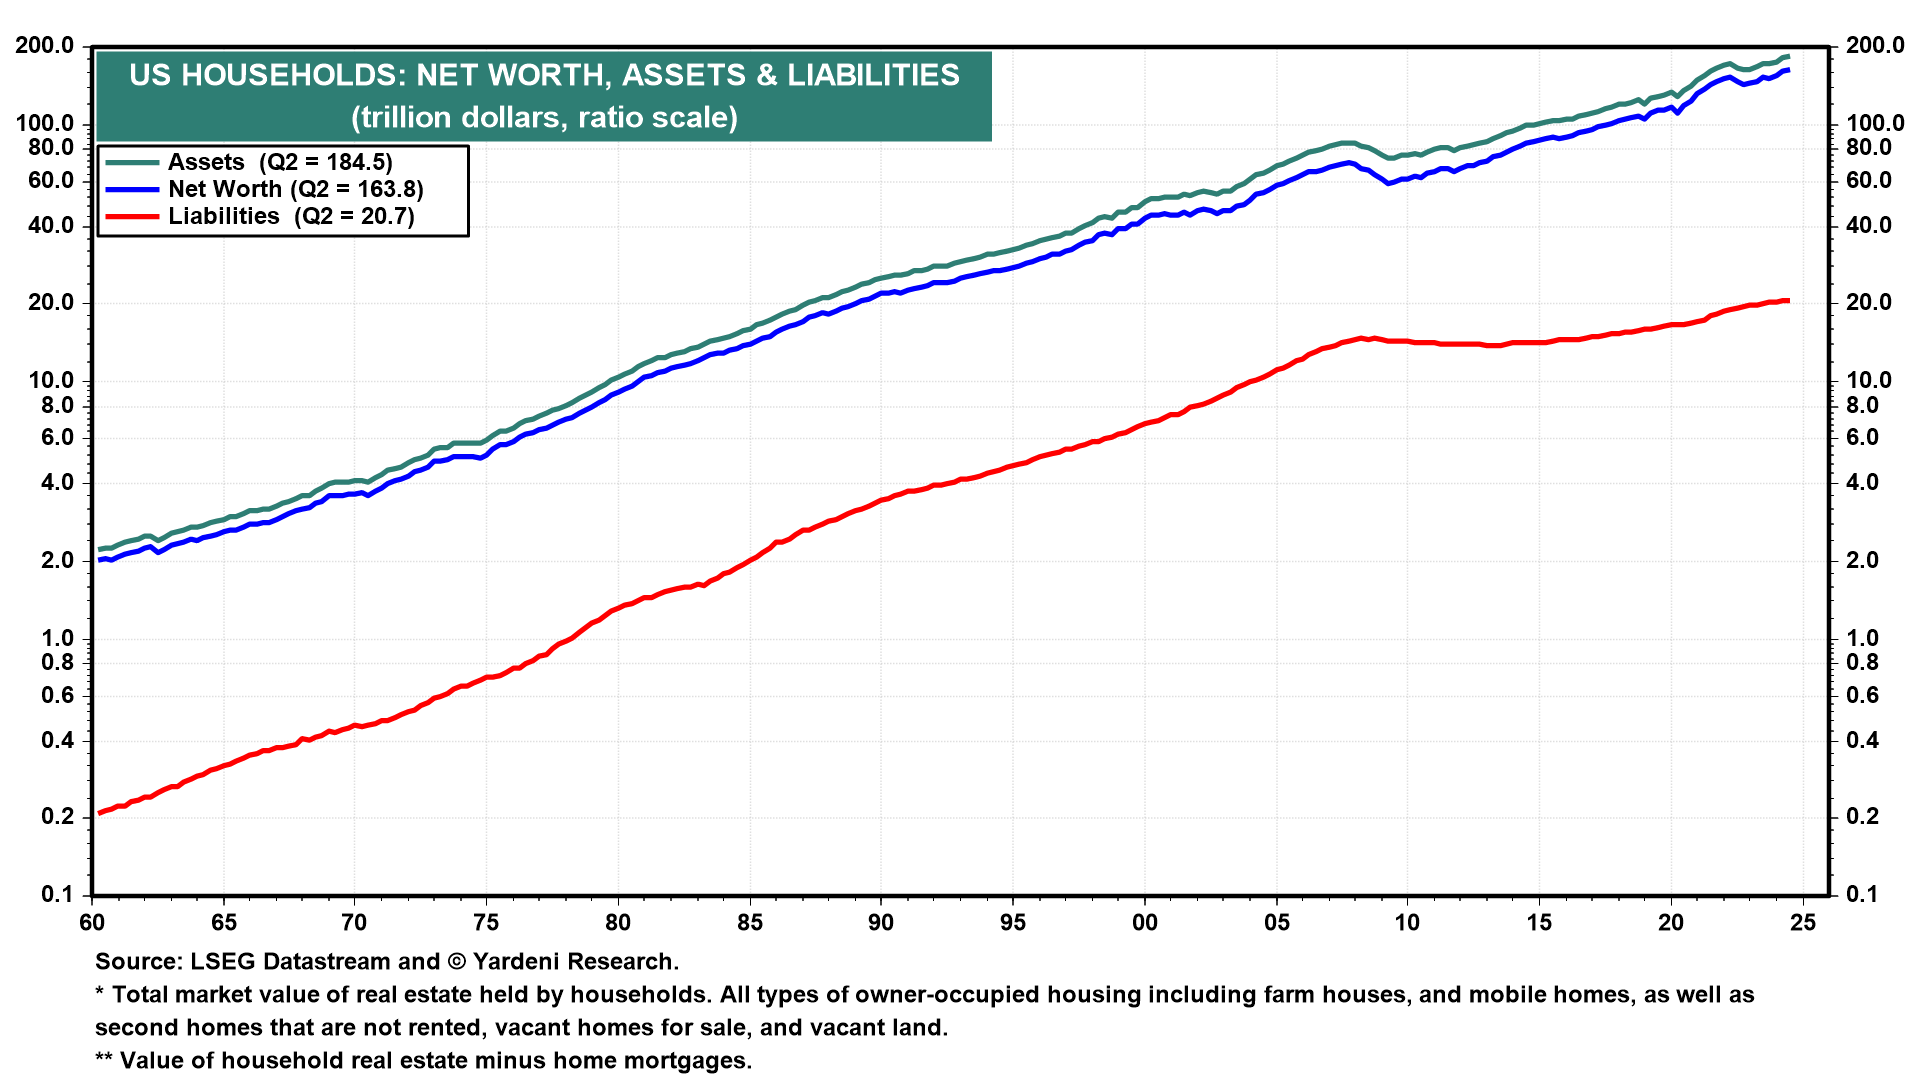
(7) We note that the net worth of all US households rose to a record $163.8 trillion in Q2-2024 (Fig. 15 below). Almost half of that sum ($79.8 trillion) was held by the Baby Boom generation in Q2-2024 (Fig. 16). During Q2-2024, the Baby Boomers held a record $23.0 trillion in corporate equities and mutual fund shares, up a whopping $6.9 trillion since just before the start of the pandemic (Fig. 17)!
(8) Many of the Baby Boomers are retiring and spending their retirement savings on goods and services as well as supporting their young adult children, who are also spending money. Indeed, Census data show that in 2024, 30.2% of people between the ages of 25 and 34 years old are living in their parent’s home (Fig. 18). The third annual review of parental patronage by savings.com (dated May 21, 2024) found that:
(i) 47% of parents with grown children provide them with some form of financial support (not including adult children with disabilities). This is a rate similar to that in last year’s report.
(ii) On average, parents providing financial support give $1,384 to their children monthly. That’s more than twice what the average working parent in the study contributed to his/her own retirement savings monthly ($609 on average).
(iii) Among parents who financially support adult children, 46% give them money for vacations and discretionary spending and 18% help their adult kids pay off credit cards.
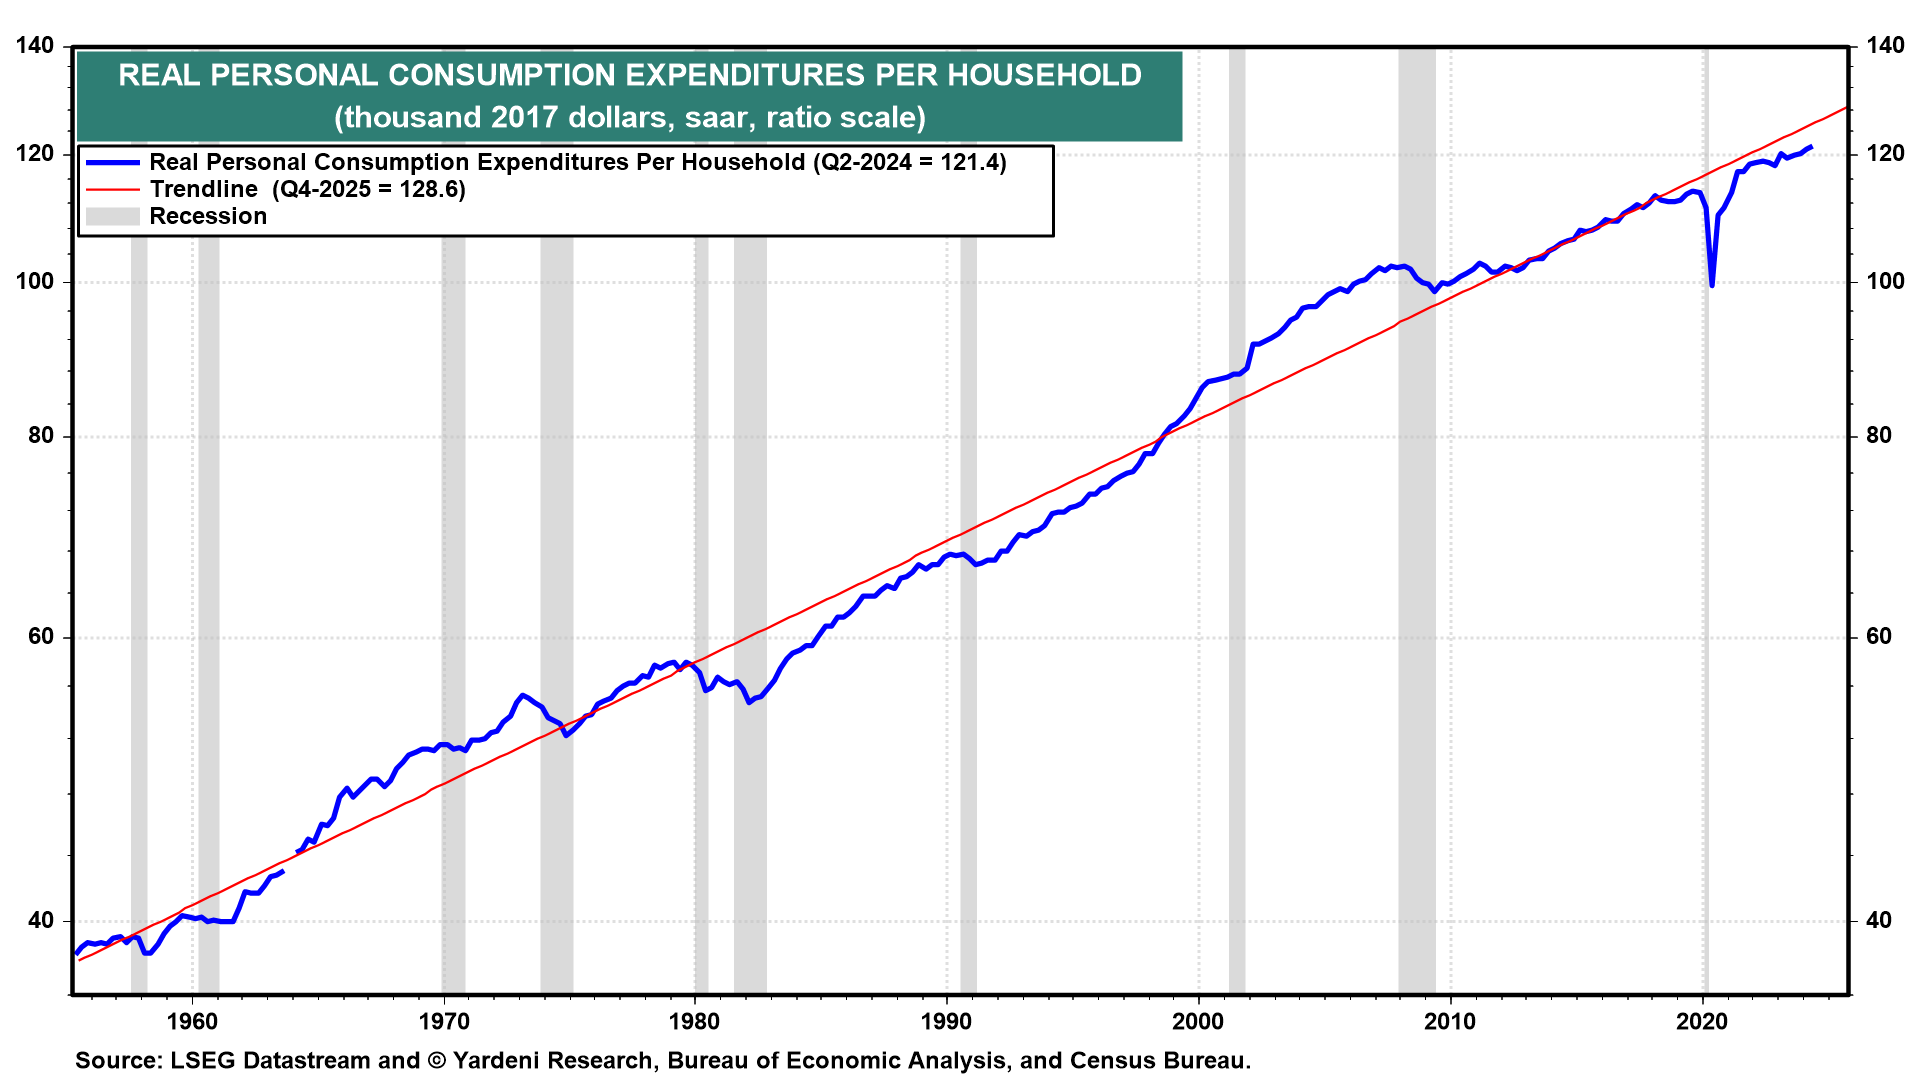
(9) Consumers are unhappy for various reasons. The cost of living has increased significantly since the start of the pandemic. However, so have wages, especially for lower-wage workers. In any event, real consumption per household rose to a record high during Q2-2024 (Fig. 19 below).
The Baby Boomers have followed the advice of Star Trek’s Spock: They have lived long and prospered. They are mostly happy now that they have paid off their mortgages, finished with college tuition, and seen their asset values soar.
Many younger people, on the other hand, can’t afford to buy a house, so they are living at home or sharing an apartment with roommates. Many probably can barely afford auto insurance. I just took my two recently employed college graduates off my auto policy. That raised the cost of their auto insurance close to $5,000 per year each! I’m helping them with that outlay.
(10) Elevated mortgage rates and home prices have crushed housing affordability. The National Association of Realtors index of affordability is currently worse than it was during the lead up to the Great Financial Crisis and lower than at any time since the early 1980s. Getting priced out of the American Dream—or watching your kids struggle to achieve it—is depressing.
Home insurance premiums also are surging alongside other housing costs and more frequent extreme weather events. Home insurance rates have increased by more than 20% across most of the country since the start of last year, per WSJ reporting. Yet those increases do not make their way into CPI. Along with the wonky owner’s equivalent rent measure, only renters’ insurance is gauged by the Bureau of Labor Statistics. Renters’ insurance is a fraction of the cost of true homeowners’ insurance, hence why it represents less than half-a-percent of the overall CPI.