


This is an excerpt from our September 30, 2024 Yardeni Research Morning Briefing. It was written before the release of September's blowout employment report on Friday, October 4.
US Economy I: Permabulls Versus Permabears.
]Some of our best friends are permabears. They are smart economists and strategists who tend to be bearish. We look to them for a thorough analysis of what could go wrong for the economy and the stock market. They are very vocal and fuel lots of pessimism about the future among the financial press and the public.
In response, to provide some balance, we examine what could go right. Often, we find that the permabears have missed something in their analyses. Since they accentuate the negatives, they often fail to see the positives, or they put negative spins on what’s essentially positive. We rarely have anything to add to the bearish case because the bears’ analyses tend to be so comprehensive. So our attempts to provide balance often cause us to accentuate the positives while still acknowledging the negatives. Not surprisingly, we get criticized for being too positive when it comes to the outlook for the US economy and stock market and get called “permabulls.”
That’s alright with us, since the US economy often grows at a solid pace, and the stock market has been on a bullish long-term uptrend as a result. Consider the following:
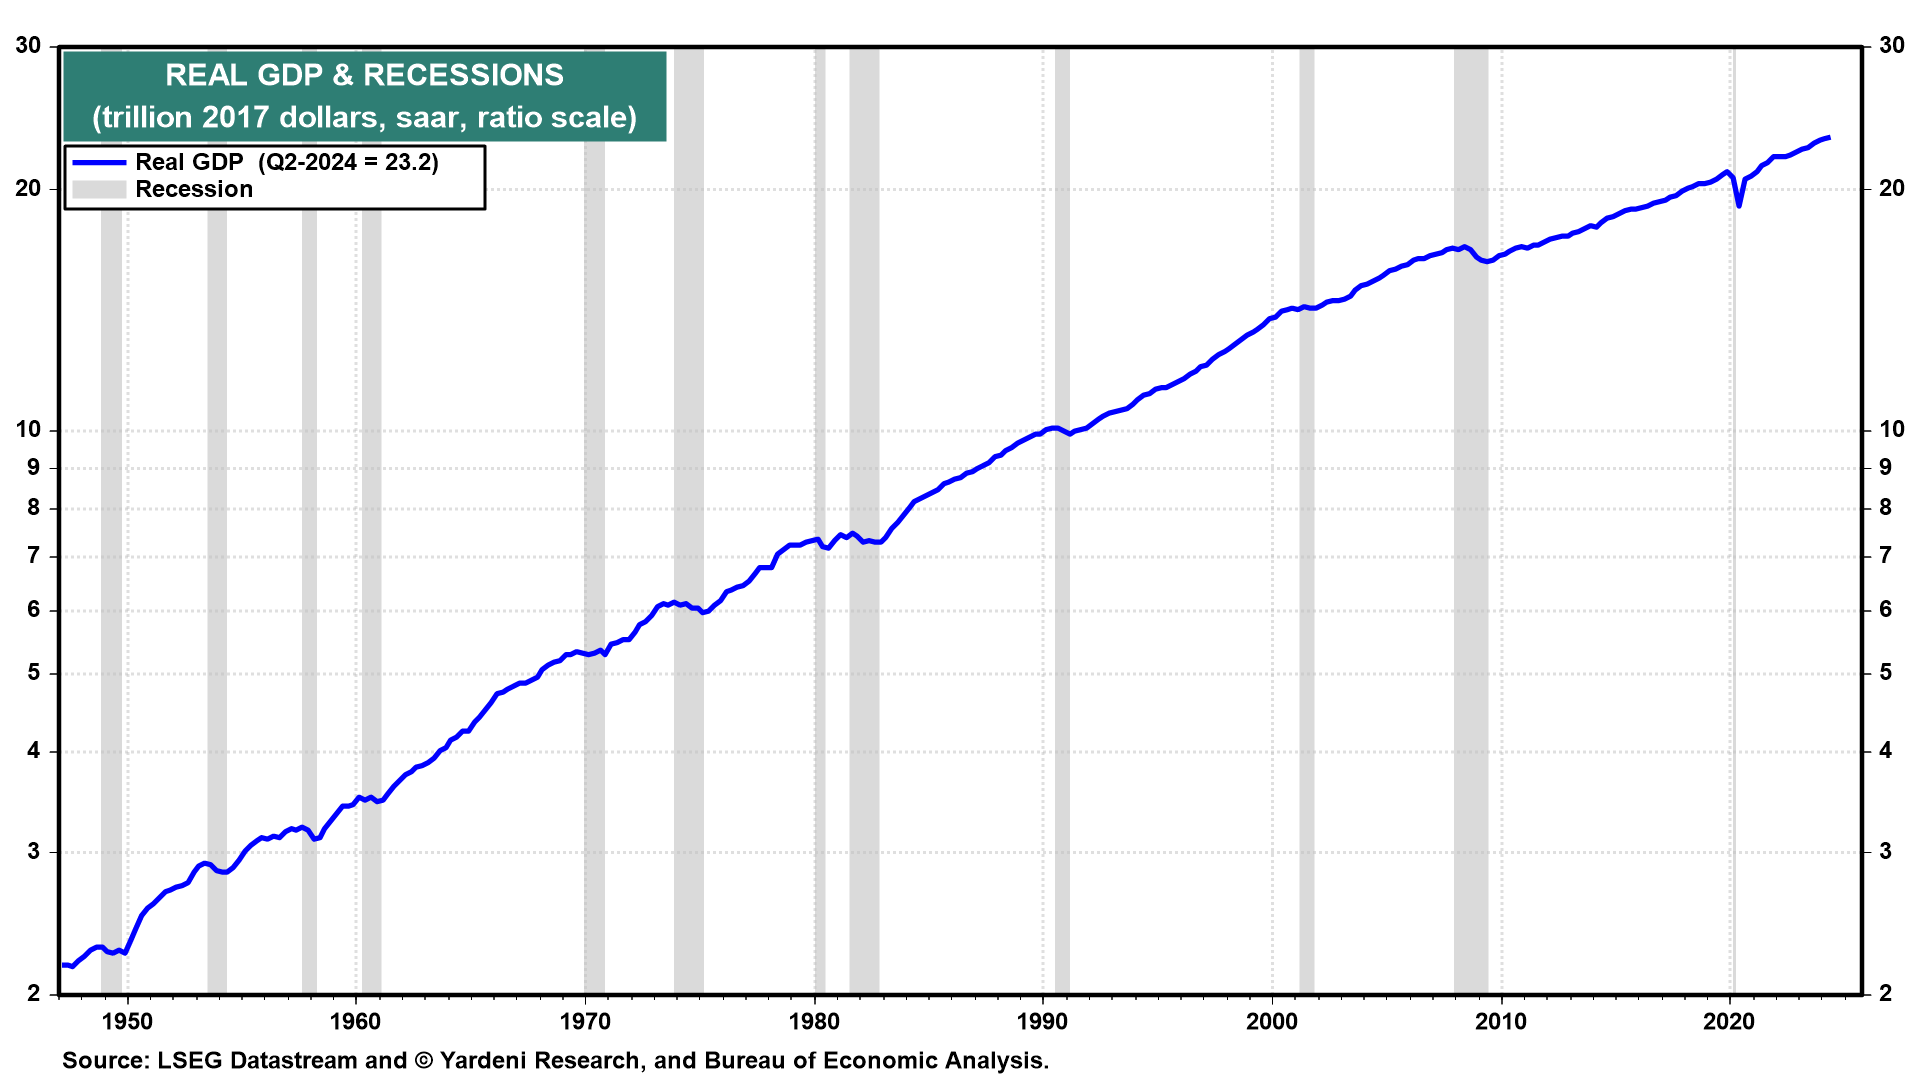
(1) Recessions are infrequent and don’t last very long (Fig. 1 below). In the US, the National Bureau of Economic Research (NBER) is the authority that defines the starting and ending dates of recessions. According to the NBER, the average US recession over the period from 1854 to 2020 lasted about 17 months. In the post-World War II period, from 1945 to 2023, the average recession lasted about 10 months. Since 1945, there have been 12 recessions that occurred during just 13% of that time span.
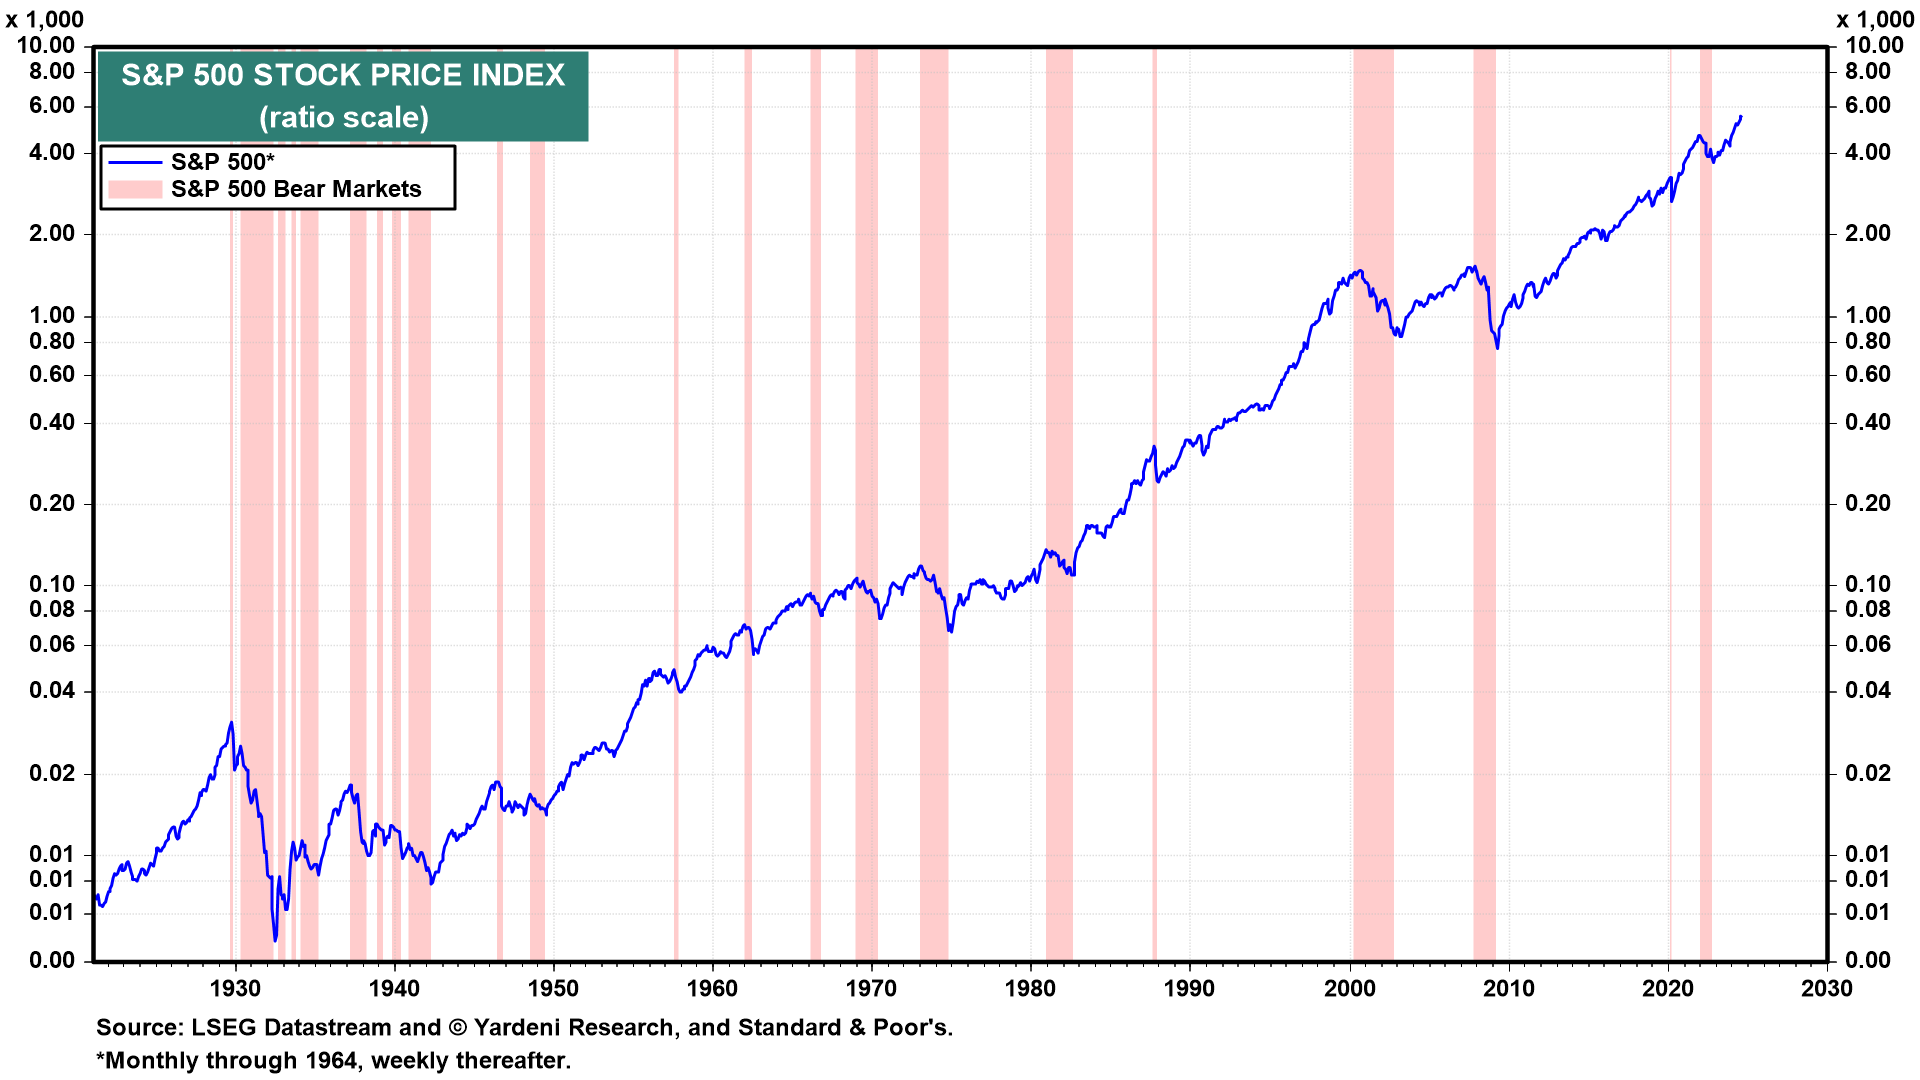
(2) The stock market has been in a secular bull market since the Great Crash of the early 1930s. Bear markets are also infrequent and don’t last very long since they tend to be caused by recessions (Fig. 2 below). According to Seeking Alpha, there have been 28 bear markets in the S&P 500 since 1928, with an average decline of 35.6%. The average length of time was 289 days, or roughly 9.5 months. ABC News reported that since World War II, bear markets on average have taken 13 months to go from peak to trough and 27 months for the stock price index to recoup lost ground. The S&P 500 index has fallen an average of 33% during bear markets over that time frame.
US Economy II: Significant Upward Revisions Show No Landing.
Among the recent pessimistic scenarios of the permabears is that real Gross Domestic Production (GDP) has been growing faster than real Gross Domestic Income (GDI). The two alternative measures of the US economy have increasingly diverged, suggesting that something is wrong with the real GDP data and that it is bound to be revised downward, consistent with the naysayers’ pessimism. They haven’t explained why they deem the GDI data to be a more accurate measure of economic activity than the GDP data.
Indeed, the Bureau of Economic Analysis (BEA), which compiles both series, favors GDP over GDI: “GDI is an alternative way of measuring the nation’s economy, by counting the incomes earned and costs incurred in production. In theory, GDI should equal gross domestic product, but the different source data yield different results. The difference between the two measures is known as the ‘statistical discrepancy.’ BEA considers GDP more reliable because it’s based on timelier, more expansive data.”
Meanwhile, the permabears have also been ringing the alarm bell about the personal saving rate lately. It had dropped to 3.3% during Q2-2024, according to the previous estimate, the lowest since Q3-2022. One permabear wrote on September 25 that “history suggests when the SR sinks this low, it usually proves unsustainable with a subsequent rise triggering a recession. The slide in the SR from 4% at the start of this year was not due to households dipping into to their pandemic-era excess savings, which have been long since spent. But it seems that households have become used to running down their savings and can’t break the habit.” His conclusion was that “the super-low US saving ratio [is] a ticking economic timebomb.”
The very next day, on September 26, the BEA released its latest revisions of Q2-2024 GDP and GDI. Much to the chagrin of the permabears, real GDI was revised significantly higher, led by an upward revision in wages and salaries—which also caused a significant upward revision in the personal saving rate!
Here is the happy news from the BEA: