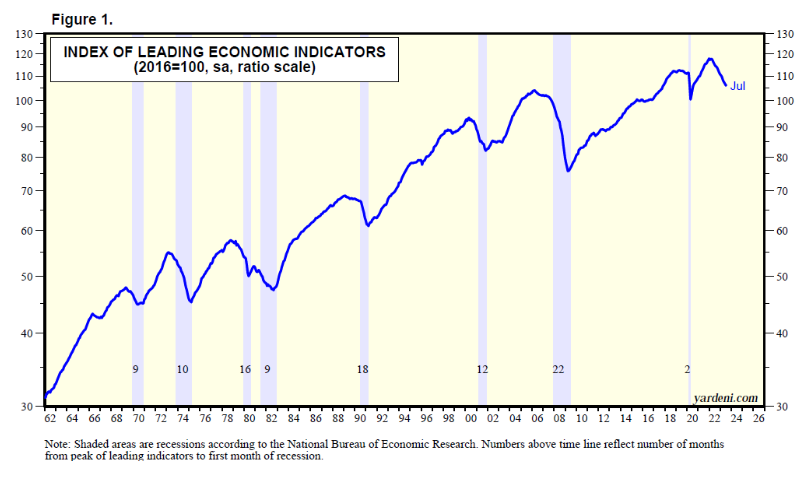
While we await Fed Chair Jerome Powell’s Jackson Hole speech on Friday, which is bound to impact the financial markets, let’s review the latest composite economic indexes.
The Conference Board compiles the Index of Leading Economic Indicators (LEI), the Index of Coincident Economic Indicators (CEI), and the Index of Lagging Economic Indicators (LAGEI). July’s indexes were released last week on Thursday. Collectively, they are a mixed bag. The LEI continues to ring the alarm bell about a recession, while the CEI continues to confirm that the economy is growing. The LAGEI is showing signs of peaking, which is what it does near the end of recessions.
So which one is right? Is the economy about to fall into a recession? Is it not about to? Or has it been in a rolling recession, which is almost over? We pick Door #3.
Here’s what we make of this trio’s July readings:
(1) LEI
The LEI peaked at a record high during December 2021 (Fig. 1 below). It is down 10.2% since then through July. It has declined for the past 16 consecutive months. It has correctly signaled the last eight recessions with an average lead time of 12 months. So a recession is overdue.

Debbie and I have previously shown that the yearly percent change in the LEI is highly correlated with the national M-PMI (Fig. 2). The same can be said for the former and the yearly percent change in real GDP for goods (Fig. 3). There’s almost no correlation between the yearly percent changes in the LEI and real GDP for services (Fig. 4).
We previously have shown that five of the 10 components of the LEI are related to the goods economy, which tends to be more cyclical than the services economy (Fig. 5). Three of the 10 relate to the financial markets. Two of the three track the labor market and consumer expectations. So the LEI over-weights the goods economy, which has been in a recession while the services economy has been booming.
In current dollars, services now account for 60.5% of nominal GDP, up from 39.8% at the start of the data in 1947 (Fig. 6).


