When comparing the performance of various stock market indexes, the financial press tends to focus on just a few including the S&P 500 index that is market-cap weighted rather than equal weighted and excludes dividends.
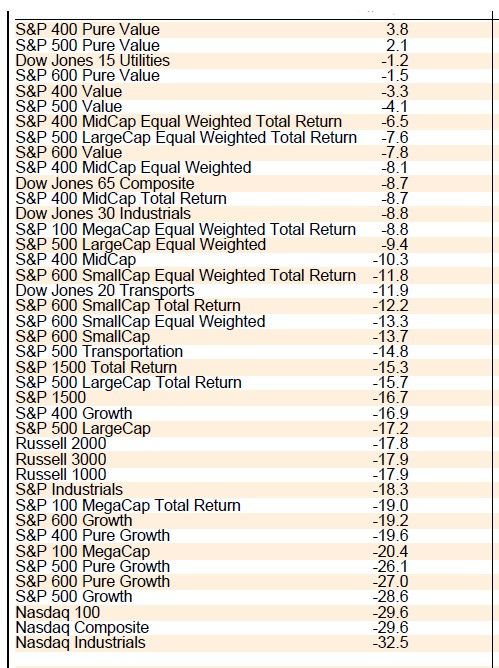
The following performance derby table shows what a difference these two other factors can make. It sorts the percent changes in the various indexes shown since January 3, 2022 through Friday's close.

The S&P 500 LargeCap index is down 17.2% since last year's peak. The total return index is down 15.7%. The LargeCap equal-weighted index is down 9.4%. The LargeCap equal-weighted total return index is down 7.6%. Diversification and dividends cushioned the downside.
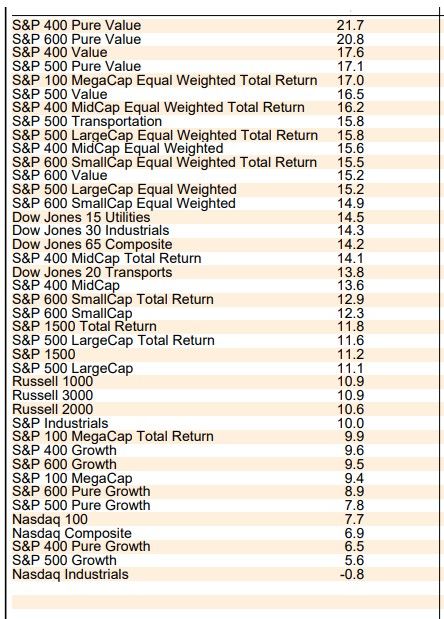
Below is the same performance derby table since last year's bear market low. While the S&P 500 is up 11.1%, the total return index is up 11.6%, the equal-weighted index is up 15.2%, and the equal-weighted total return index is up 15.8%.


